Page History
...
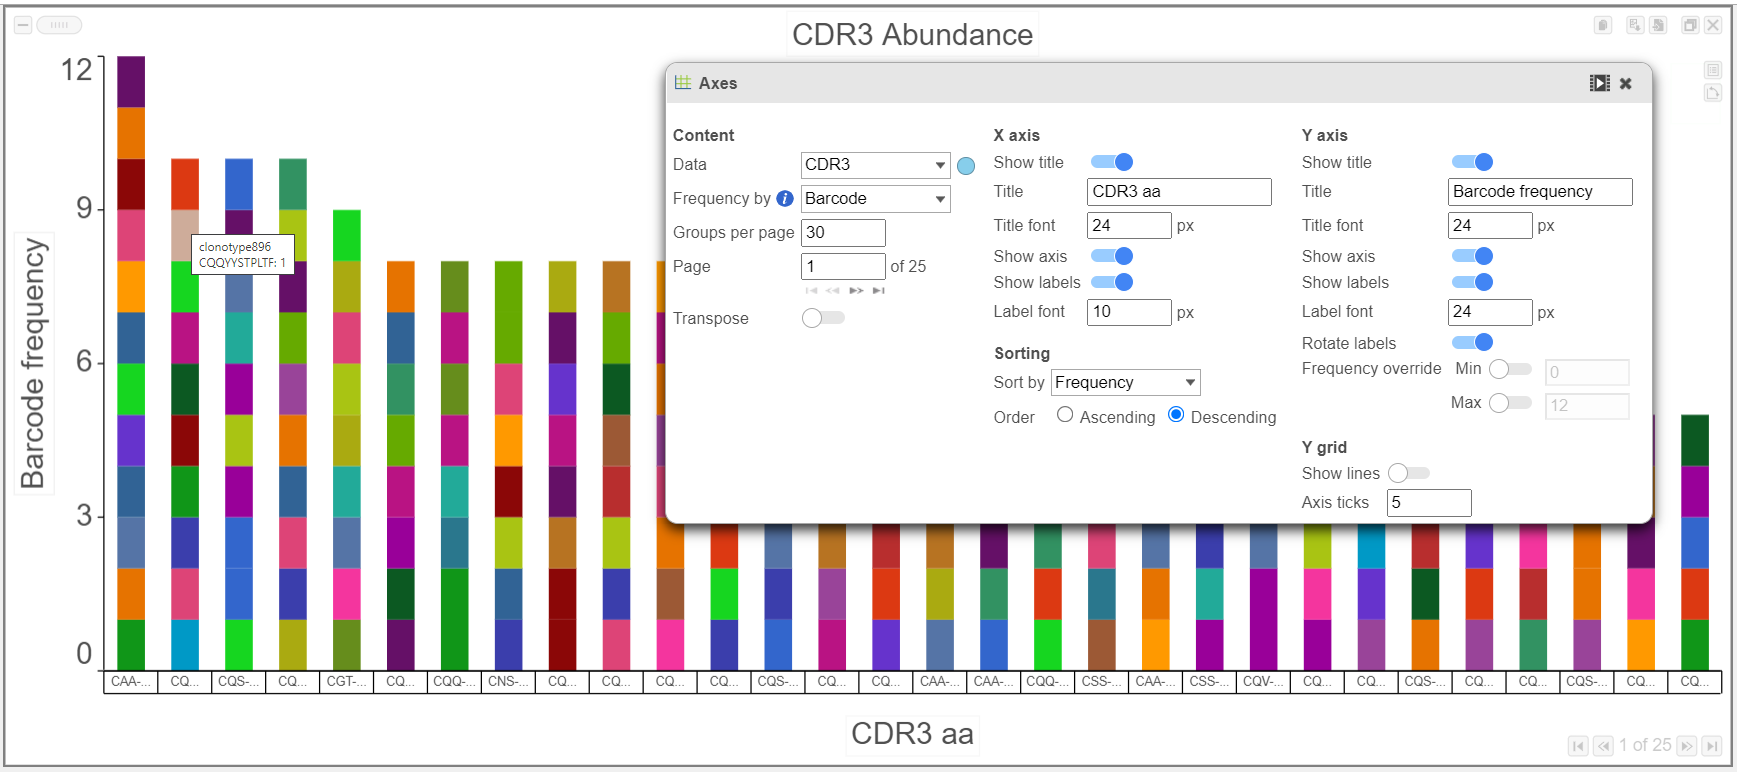
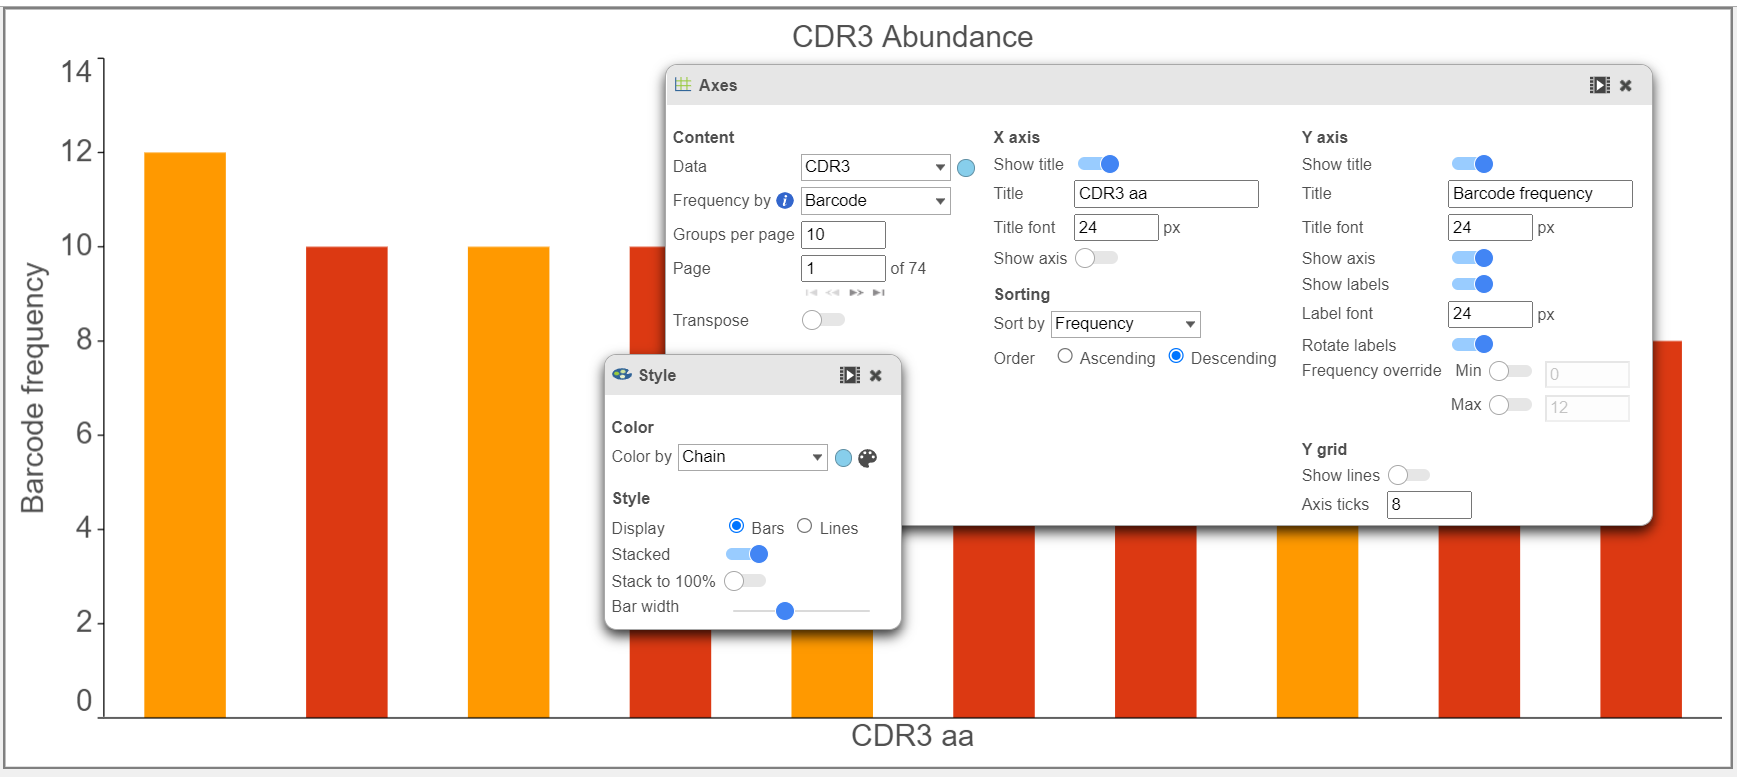
- Below, CDR3 abundance is plotted by barcode frequency and colored by Clonotype ID in the top Bar chart. In the bottom example, the plot is instead colored by Chain and other modifications, such as axis ticks and the number of groups per page, has been made. Note that the predicted CDR3 amino acid sequence is plotted here, but the predicted CDR3 nucleotide sequence (cdr3_nt) as well as information for other Complementarity-Determining Regions is also available.


- Gene usage plots for the V, D, and J genes can be plotted many ways, as seen by the Bar chart examples below for the V gene. In the top plot, barcode frequency for V genes is sorted by frequency in descending order and colored by Chain. The transposed plot below shows all of the groups sorted by ascending value and the heavy chain has been excluded.
...
Overview
Content Tools