...
| Numbered figure captions |
|---|
| SubtitleText | Setting up Coverage report. The example on the figure shows the use of a custom annotation file, CRCTargets, which defines target regions for a targeted resequencing panel |
|---|
| AnchorName | coverage-dialog |
|---|
|
 Image Removed Image Removed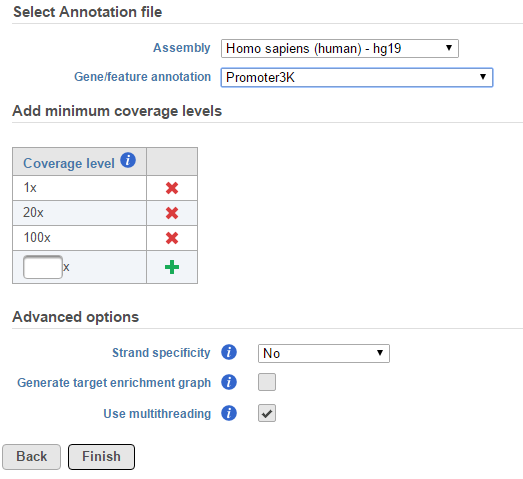 Image Added Image Added
|
Coverage report result page contains project-level overview and starts with a summary table, with one sample per row (Figure 2). The first few columns show the percentage of bases in the genomic features which are covered at the specified level (or higher) (default: 1×, 20×, 100×). Average coverage is defined as the sum of base calls of each base in the genomic features divided by the length of the genomic features. Similarly, Average quality is defined as the sum of average quality of those bases that cover the genomic features, divided by the length of covered genomic features. The last two columns show the number of On-tarted reads (overlapping the genomic features) and Off-target reads (not overlapping the features).
...