...
| Numbered figure captions |
|---|
| SubtitleText | Coverage report, project-level overview (an example). Each row is a sample. The default coverage columns (1×, 20×, 100×) are shown |
|---|
| AnchorName | project-overview-table |
|---|
|
 Image Removed Image Removed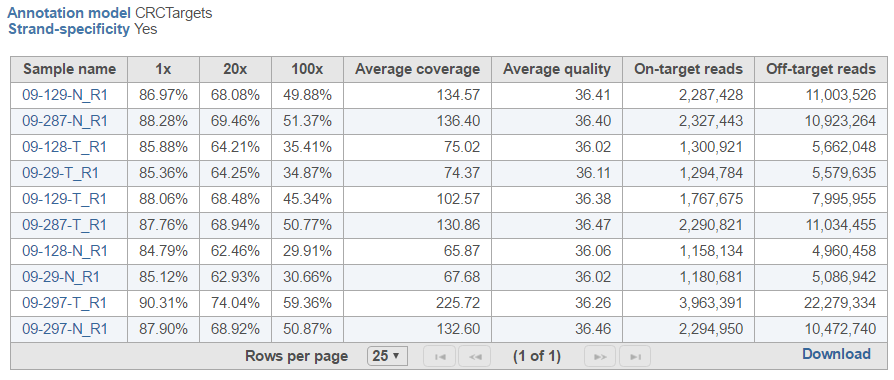 Image Added Image Added
|
Quantification of on- and off-target reads is also displayed in the column chart below the table (Figure 3), showing each sample as a separate column and fraction of on-/off-target reads on the y-axis.
...