Page History
...
| Numbered figure captions | ||||||
|---|---|---|---|---|---|---|
| ||||||
|
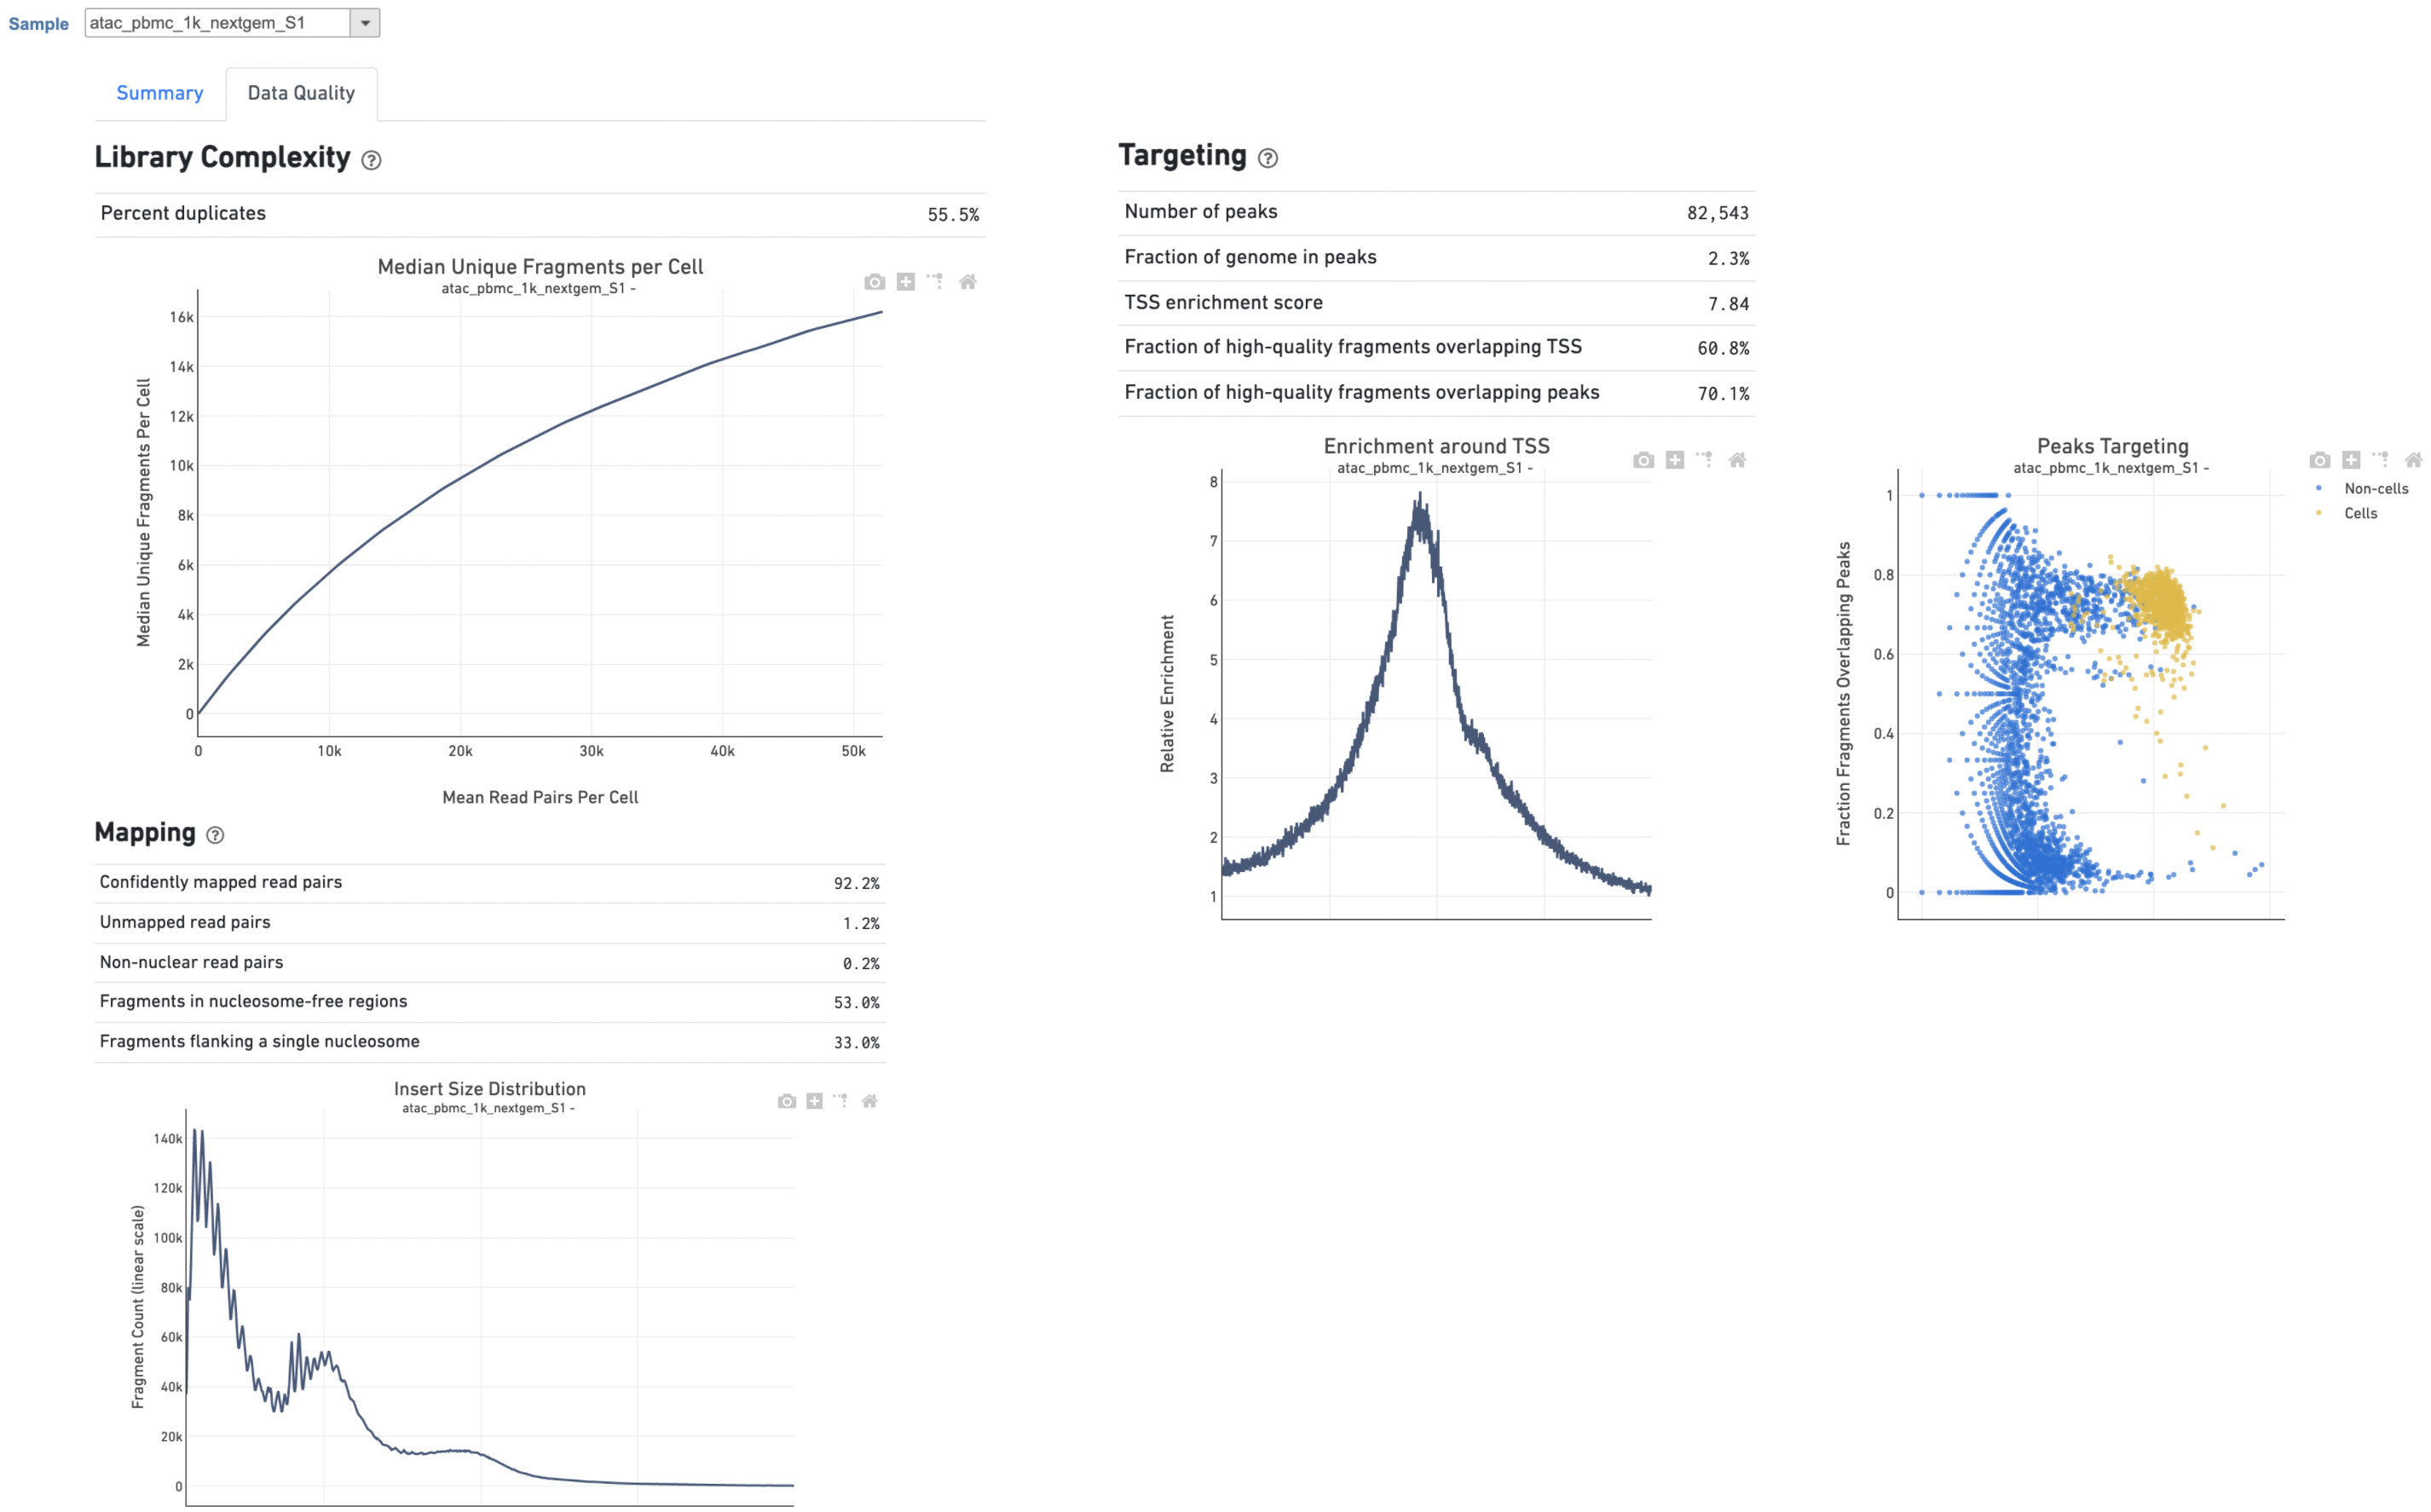
A new data node named Single cell counts will be displayed in Flow if the task has been finished successfully (Figure 4). This data node contains a filtered peak barcode count matrix for ATAC-Seq data, but a unified feature-barcode matrix that contains gene expression counts alongside ATAC-Seq peak counts for each cell barcode for multiomic data. To open the task report when the task is finished, double click the output data node, or select the Task report in the Task results section after single clicking the data node. Users then will find the task report (Figure 4) is the same as the ‘Summary HTML’ from Cell Ranger ATAC output.
...
| Numbered figure captions | ||||
|---|---|---|---|---|
| ||||
|
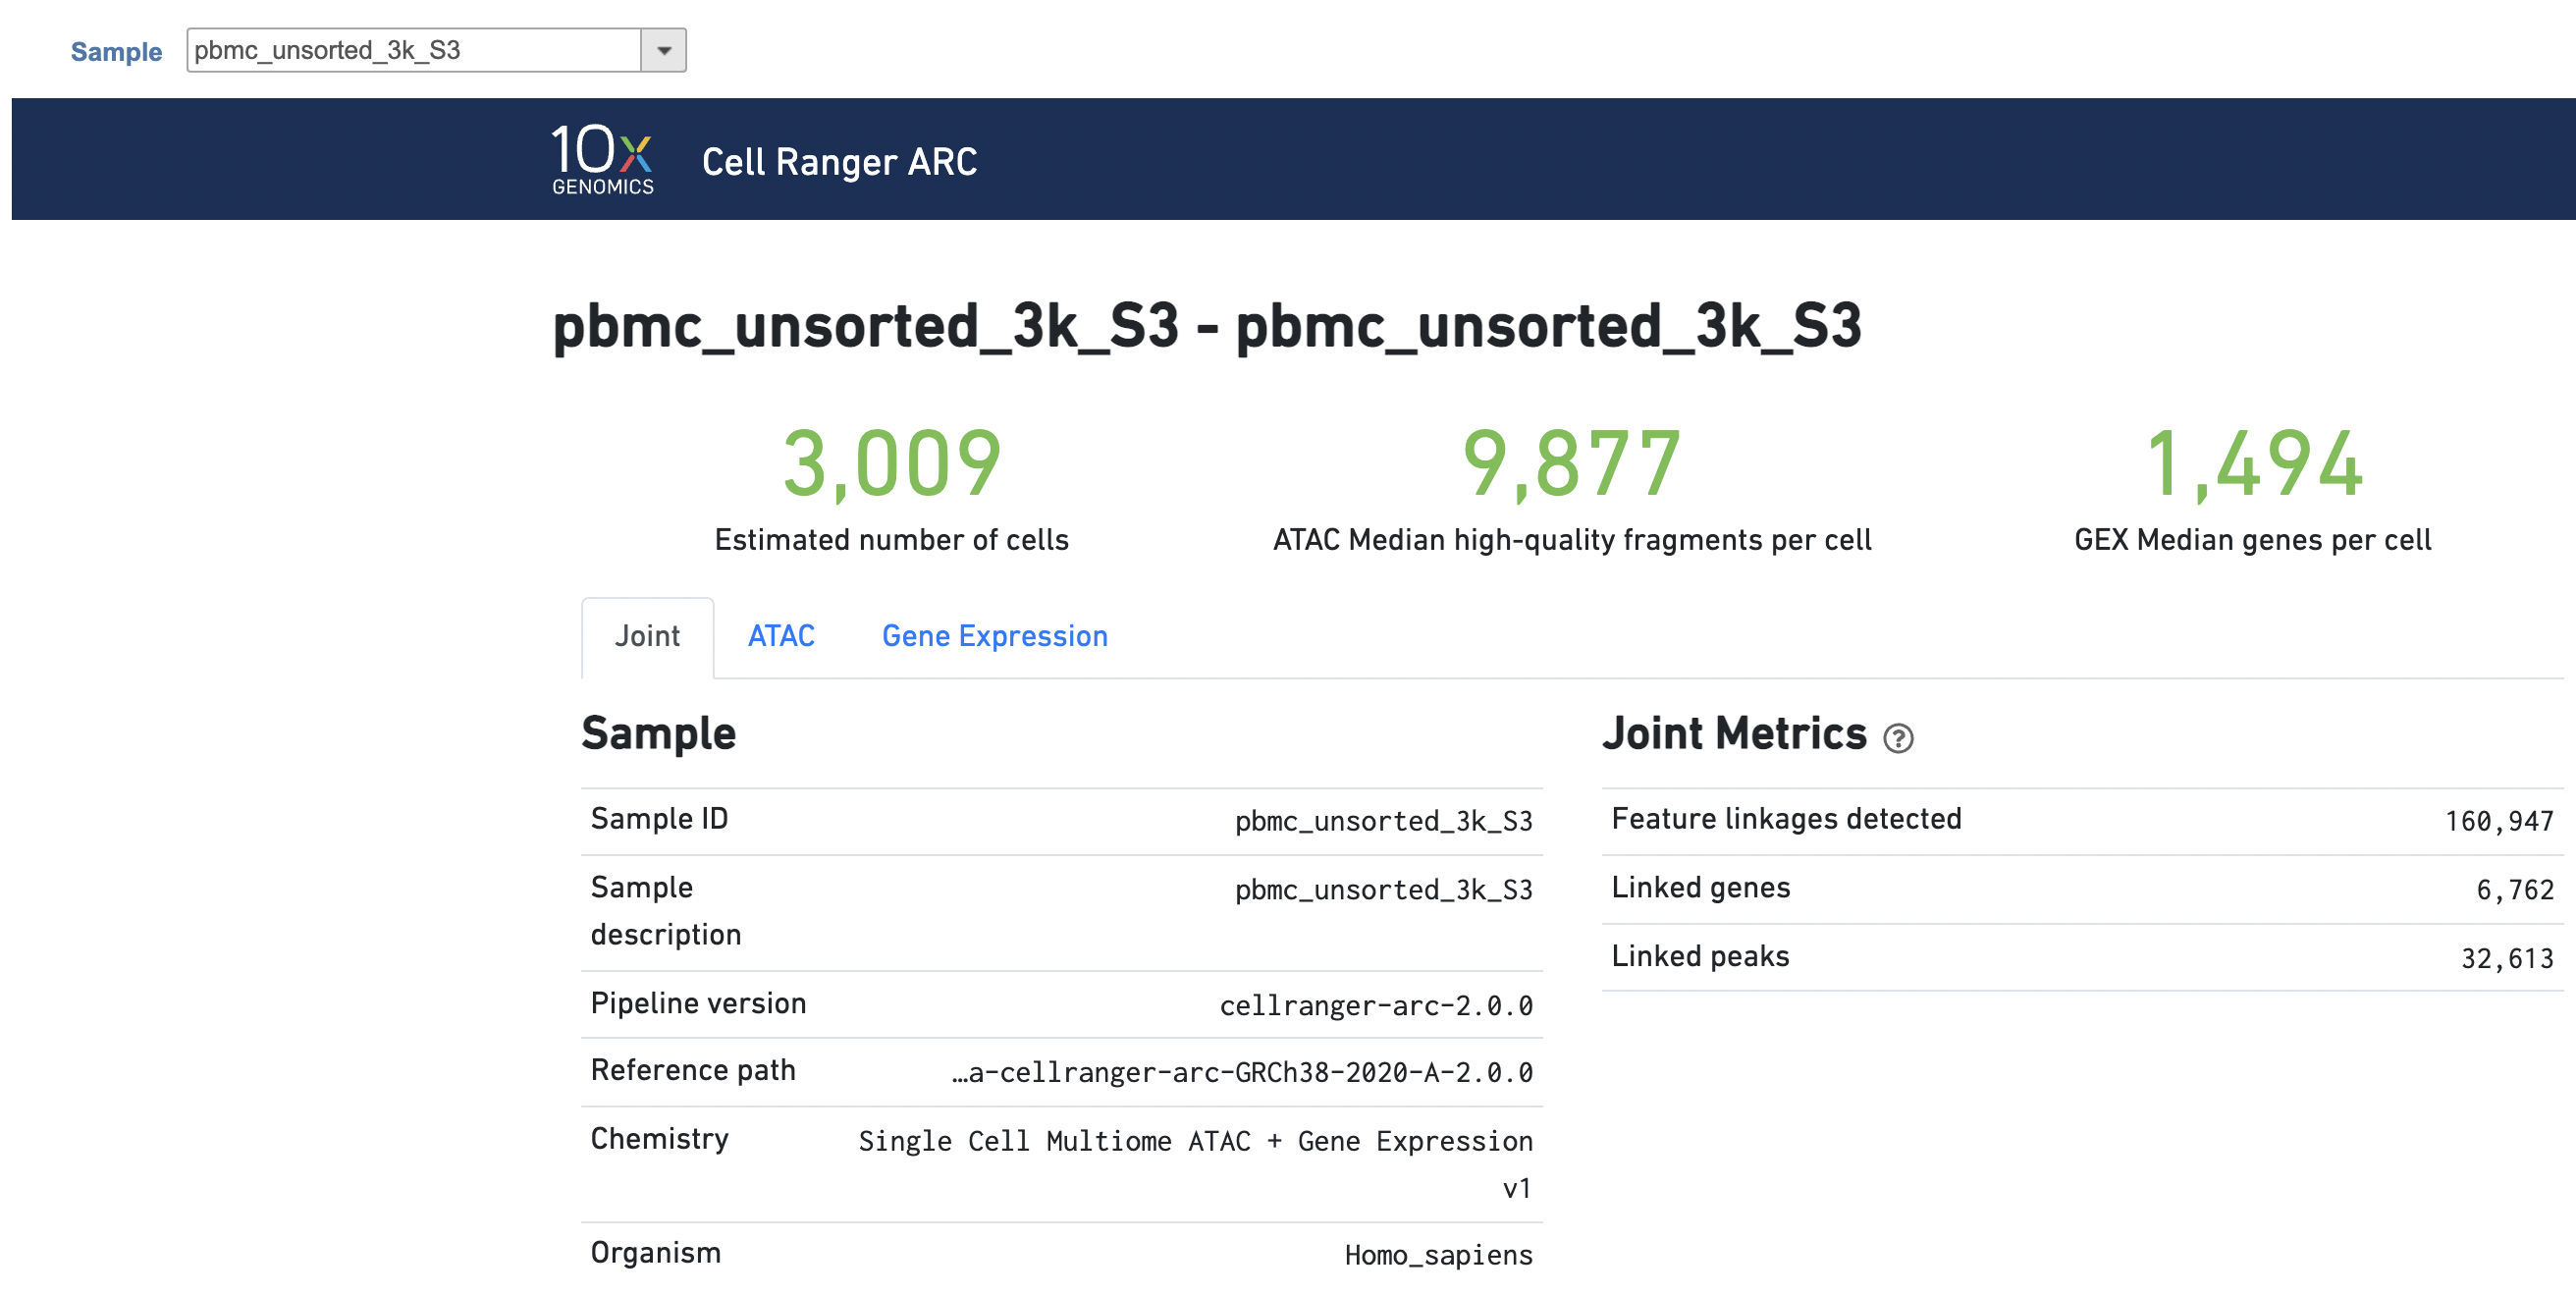
The task report for multiomic data analysis is much more complicated. It contains summary metrics at different levels - ATAC, gene expression, both/joint. Joint view is the default view visible upon first rendering the summary and can be accessed by clicking "Joint" at the top left corner. Metrics that are specific to the given Chromatin Accessibility library will appear in the ATAC tab. Lastly, metrics that are specific to the given gene expression library will appear in the Gene Expression tab (Figure 7). To understand the details, please refer to 10x Genomics webpage[4].
| Numbered figure captions | ||||
|---|---|---|---|---|
| ||||
|
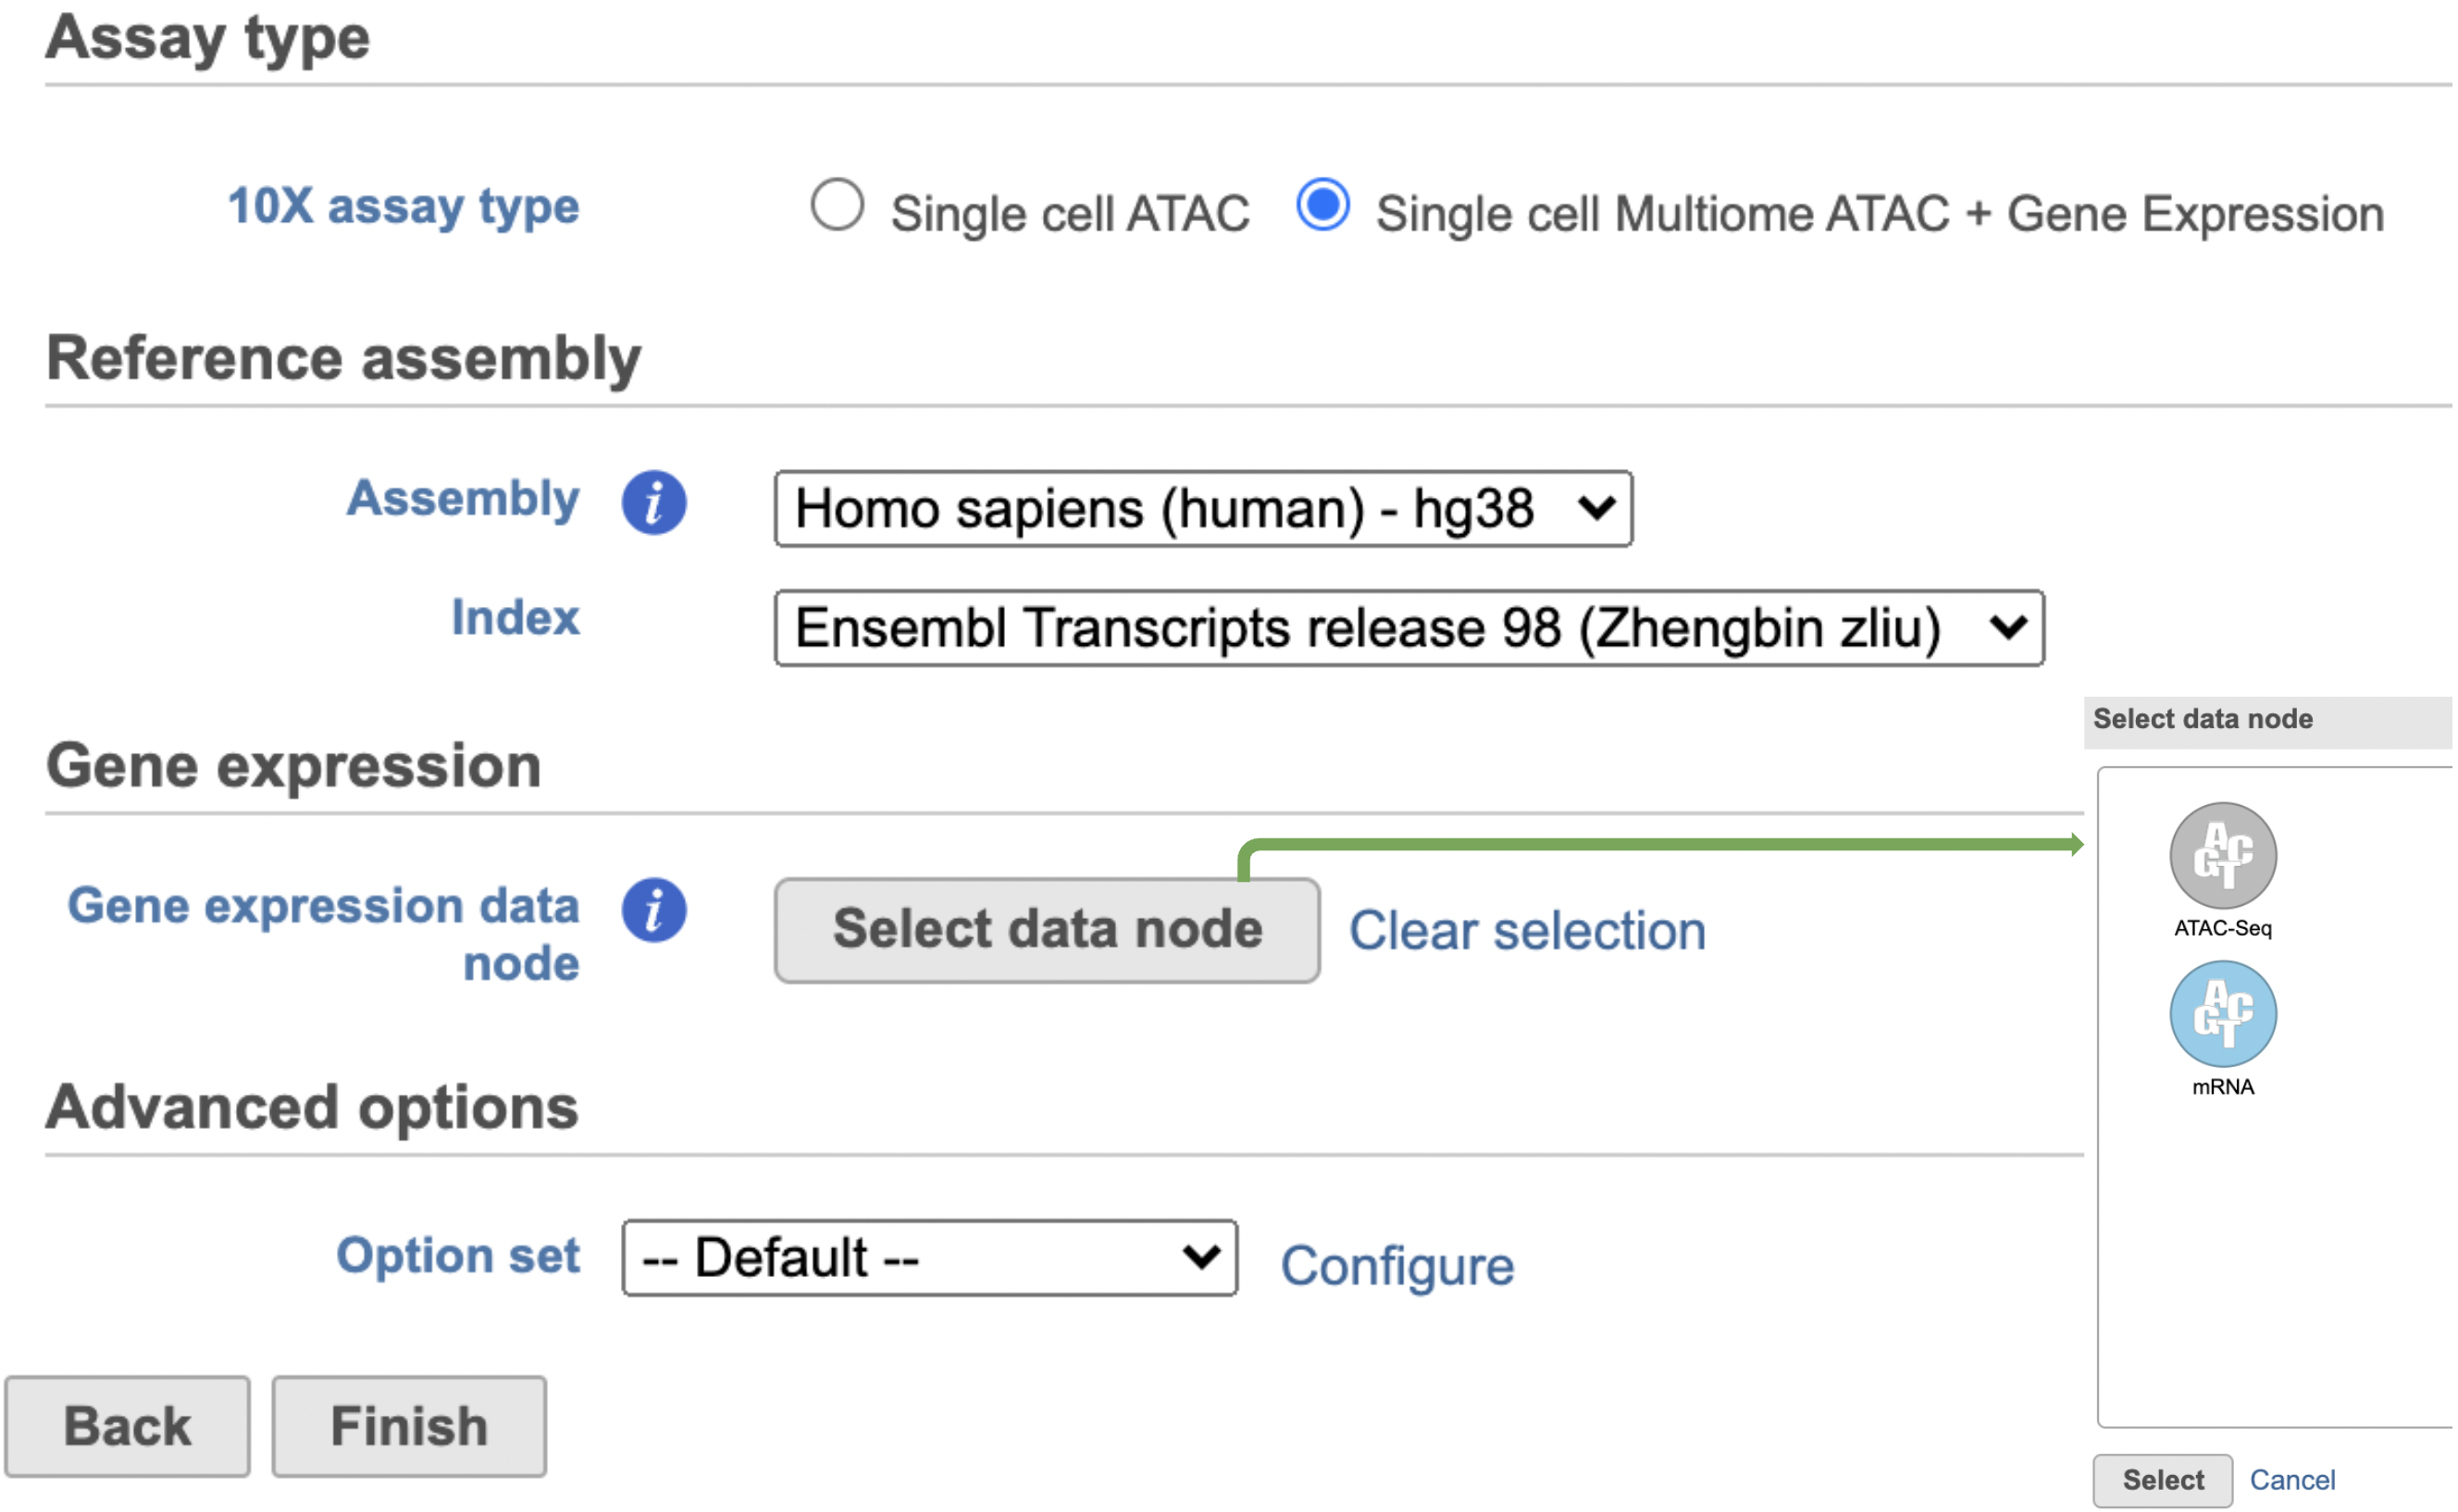
Other adjustable parameters in this task (Figure 2) include:
...
Overview
Content Tools