Page History
...
Cell Ranger - ATAC in Partek Flow
The Cell Ranger - ATAC task in Partek® Flow® includes two different wrappers. To deal with the single cell ATAC-seq dataset, the 'cellranger-atac count' pipeline from Cell Ranger ATAC v2.0[2] has been wrapped in Partek® Flow® as Cell Ranger - ATAC taskFlow®. It takes FASTQ files from from 'cellranger-atac mkfastq' and and performs ATAC analysis including reads reads filtering and alignment, barcode counting, identification of transposase cut sites, peak and cell calling, count matrix generation. Its outputs then becomes then become the starting point for downstream analysis for scATAC-seq data in Flow. To process Chromium Single Cell Multiome ATAC + Gene Expression sequencing data, ‘cellranger-arc count’ v2.0[3] has been wrapped to generate a variety of analyses pertaining to gene expression, chromatin accessibility and their linkage.
Running Cell Ranger - ATAC in Flow
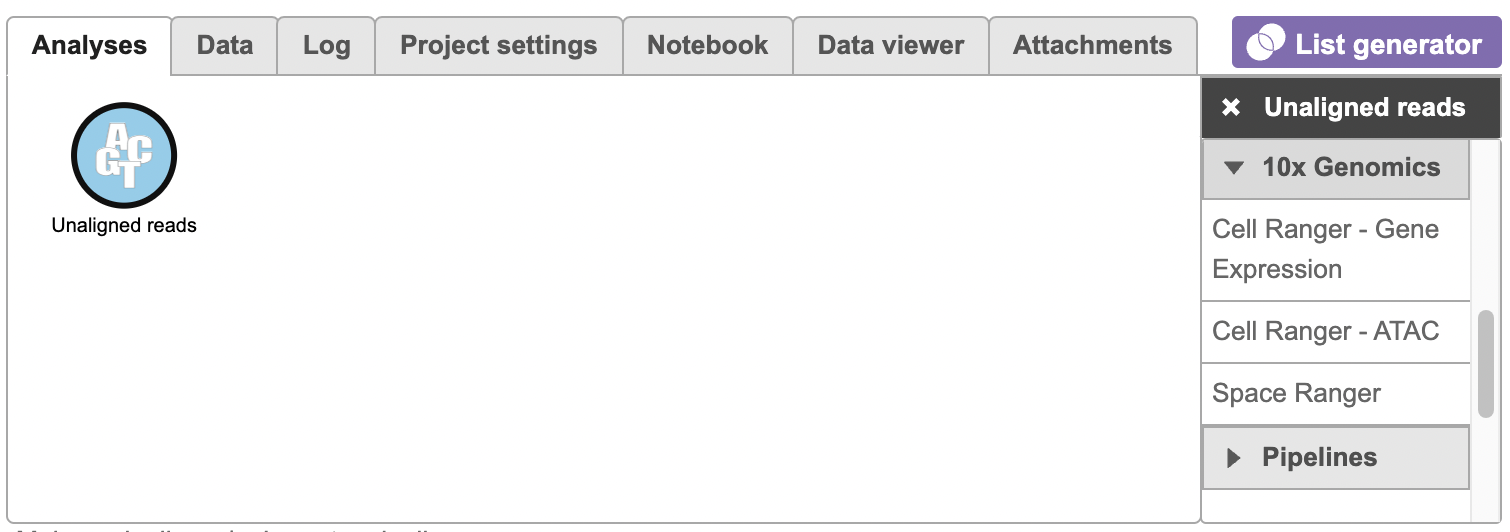
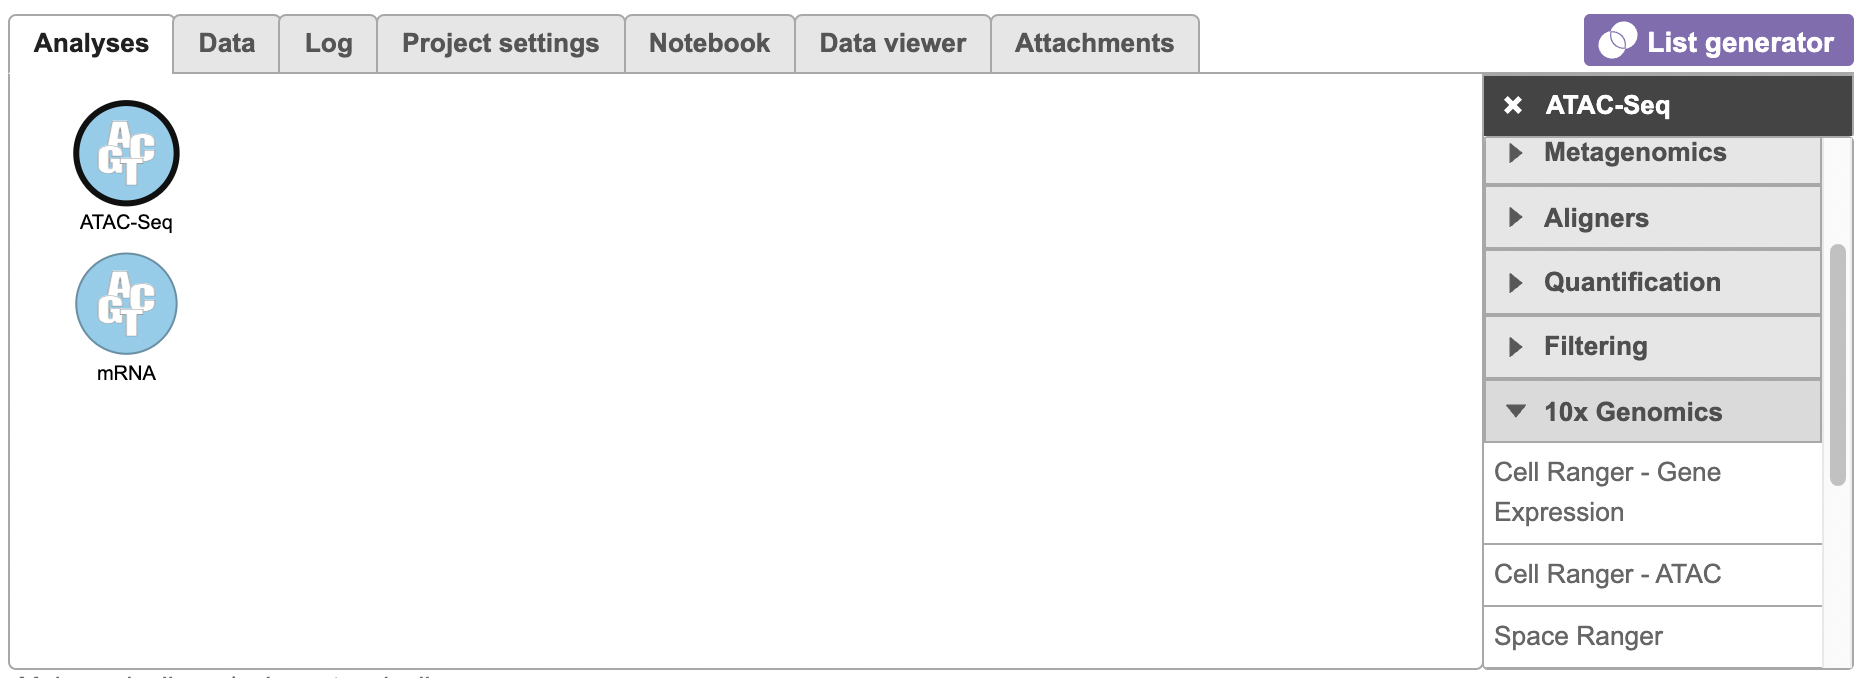
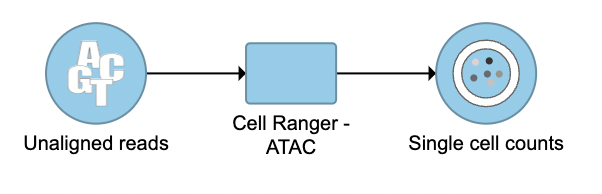
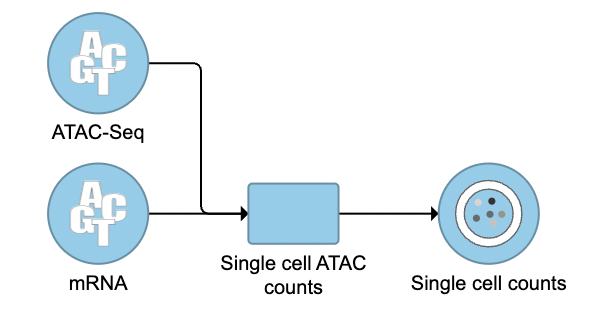
To run the Cell Ranger - ATAC task task for scATAC-seq data in Flow, select Unaligned reads datanode datanode, then select Cell Ranger - ATAC in in the 10x Genomics section section (left panel, Figure 1). For 10x multiome ATAC + Gene Expression data, there will be two data nodes once the FASTQ files have been imported into Flow properly - ATAC-Seq and mRNA (right panel, Figure 1). Users should select ATAC-Seq datanode to trigger the Cell ranger - ATAC task.
| Numbered figure captions | ||||
|---|---|---|---|---|
| ||||
|
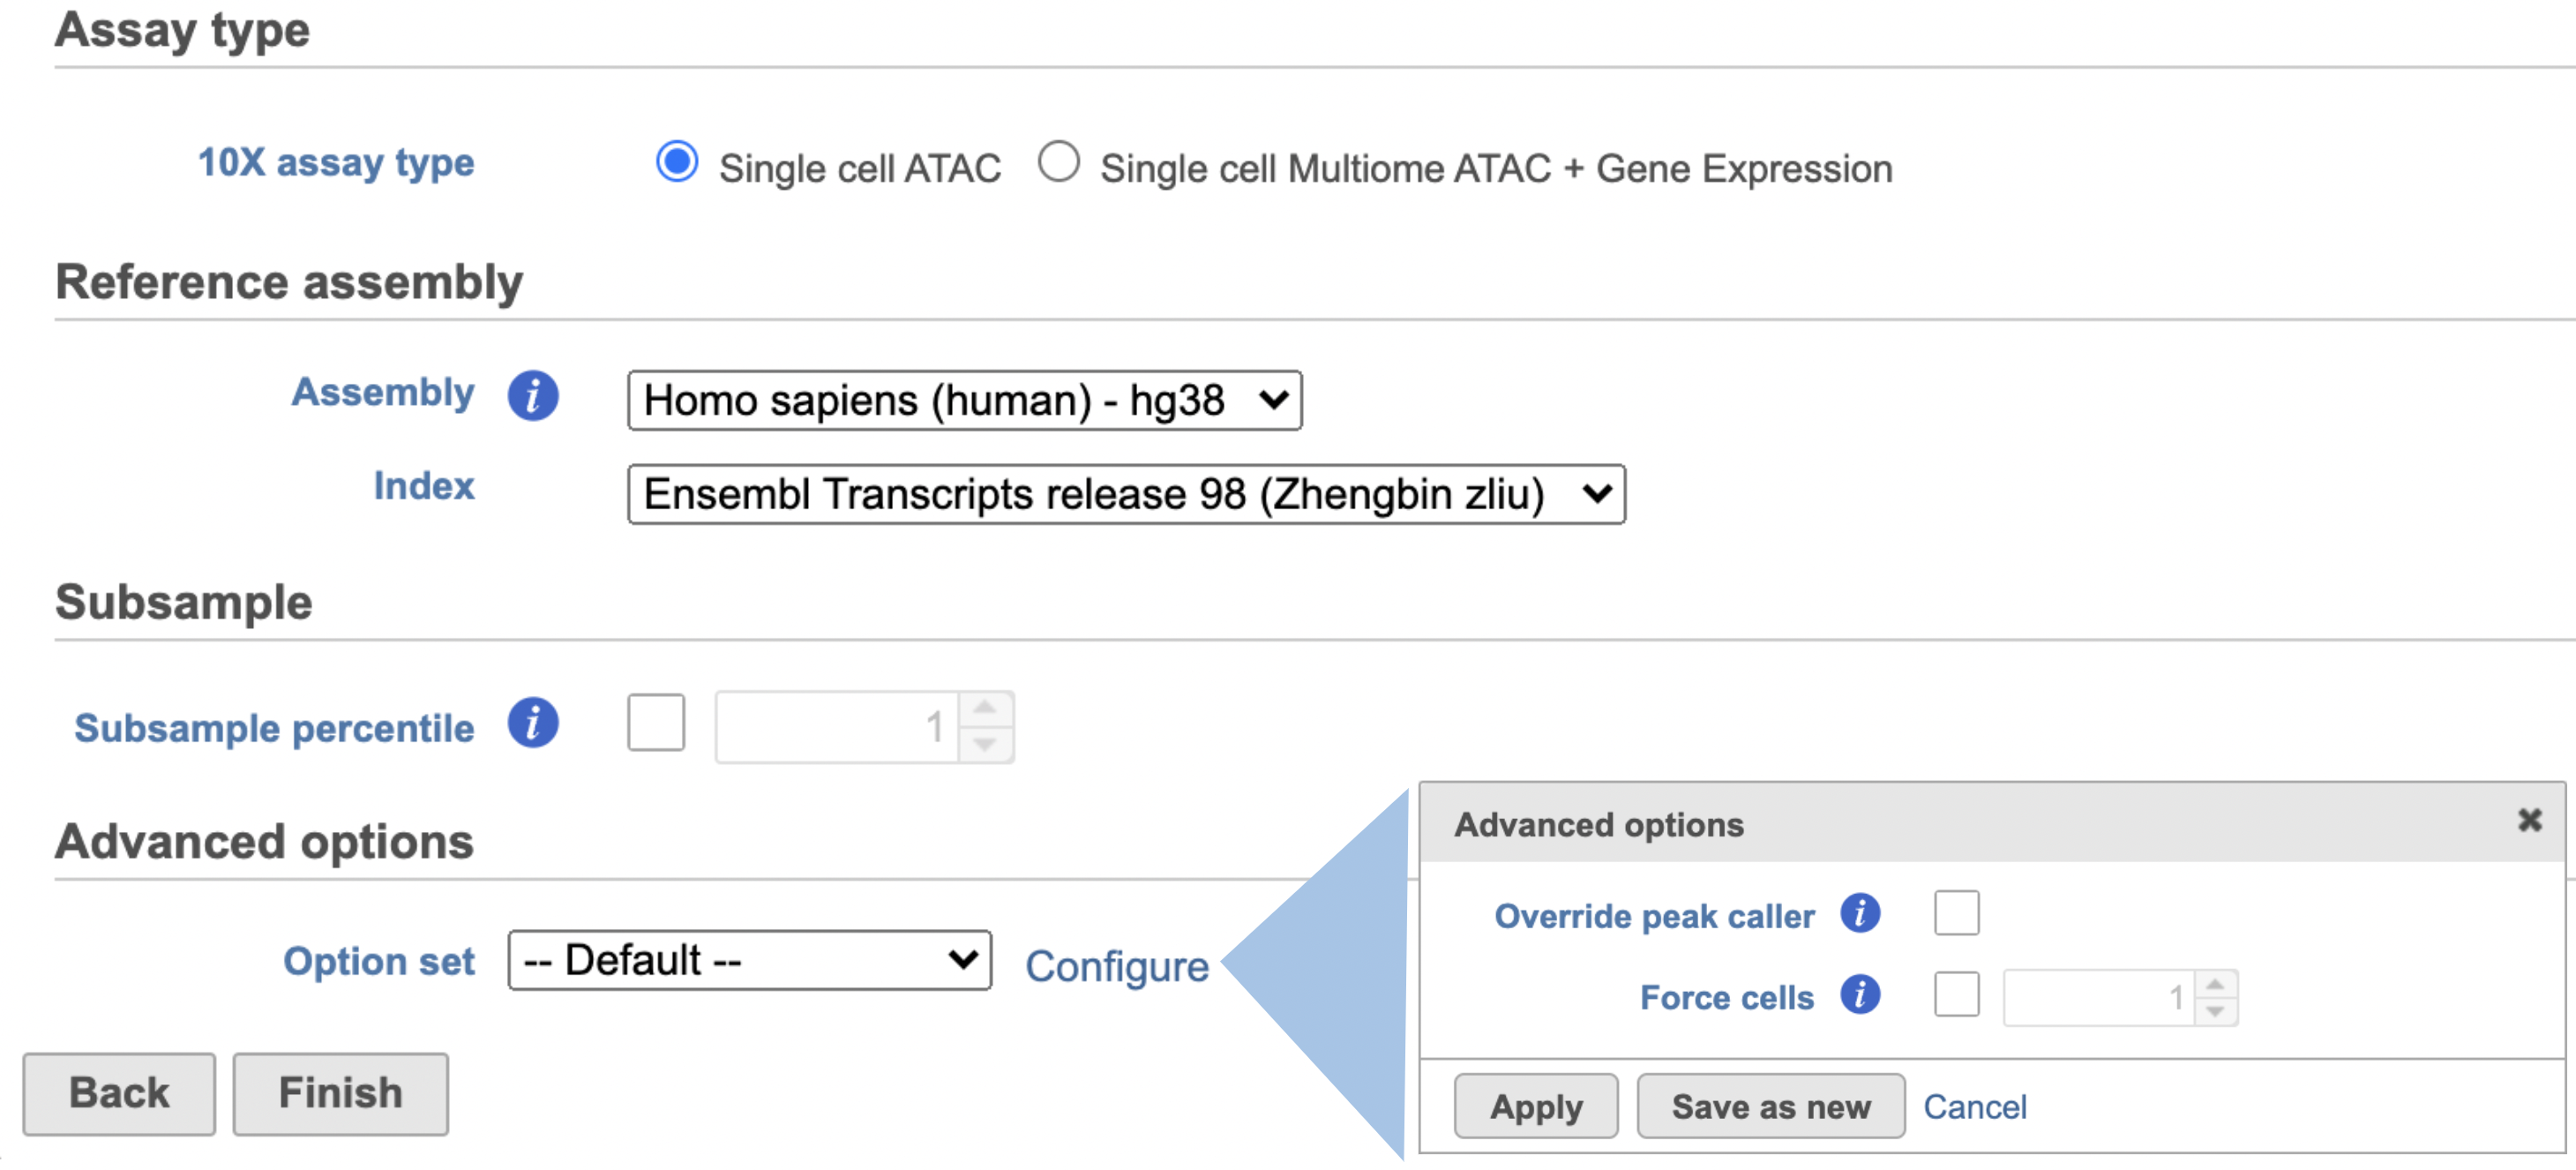
Similar to Cell Ranger - Gene Expression task, the first time user will be asked to create a Reference assembly. In Partek® Flow®, we will use Cell Ranger ARC 2.0.0 to create reference assembly for all 10x Genomics analysis pipelines. Please refer to our Cell Ranger - Gene Expression task manual on how to build or use Reference assembly.
...
| Numbered figure captions | ||||
|---|---|---|---|---|
| ||||
| ||||
|

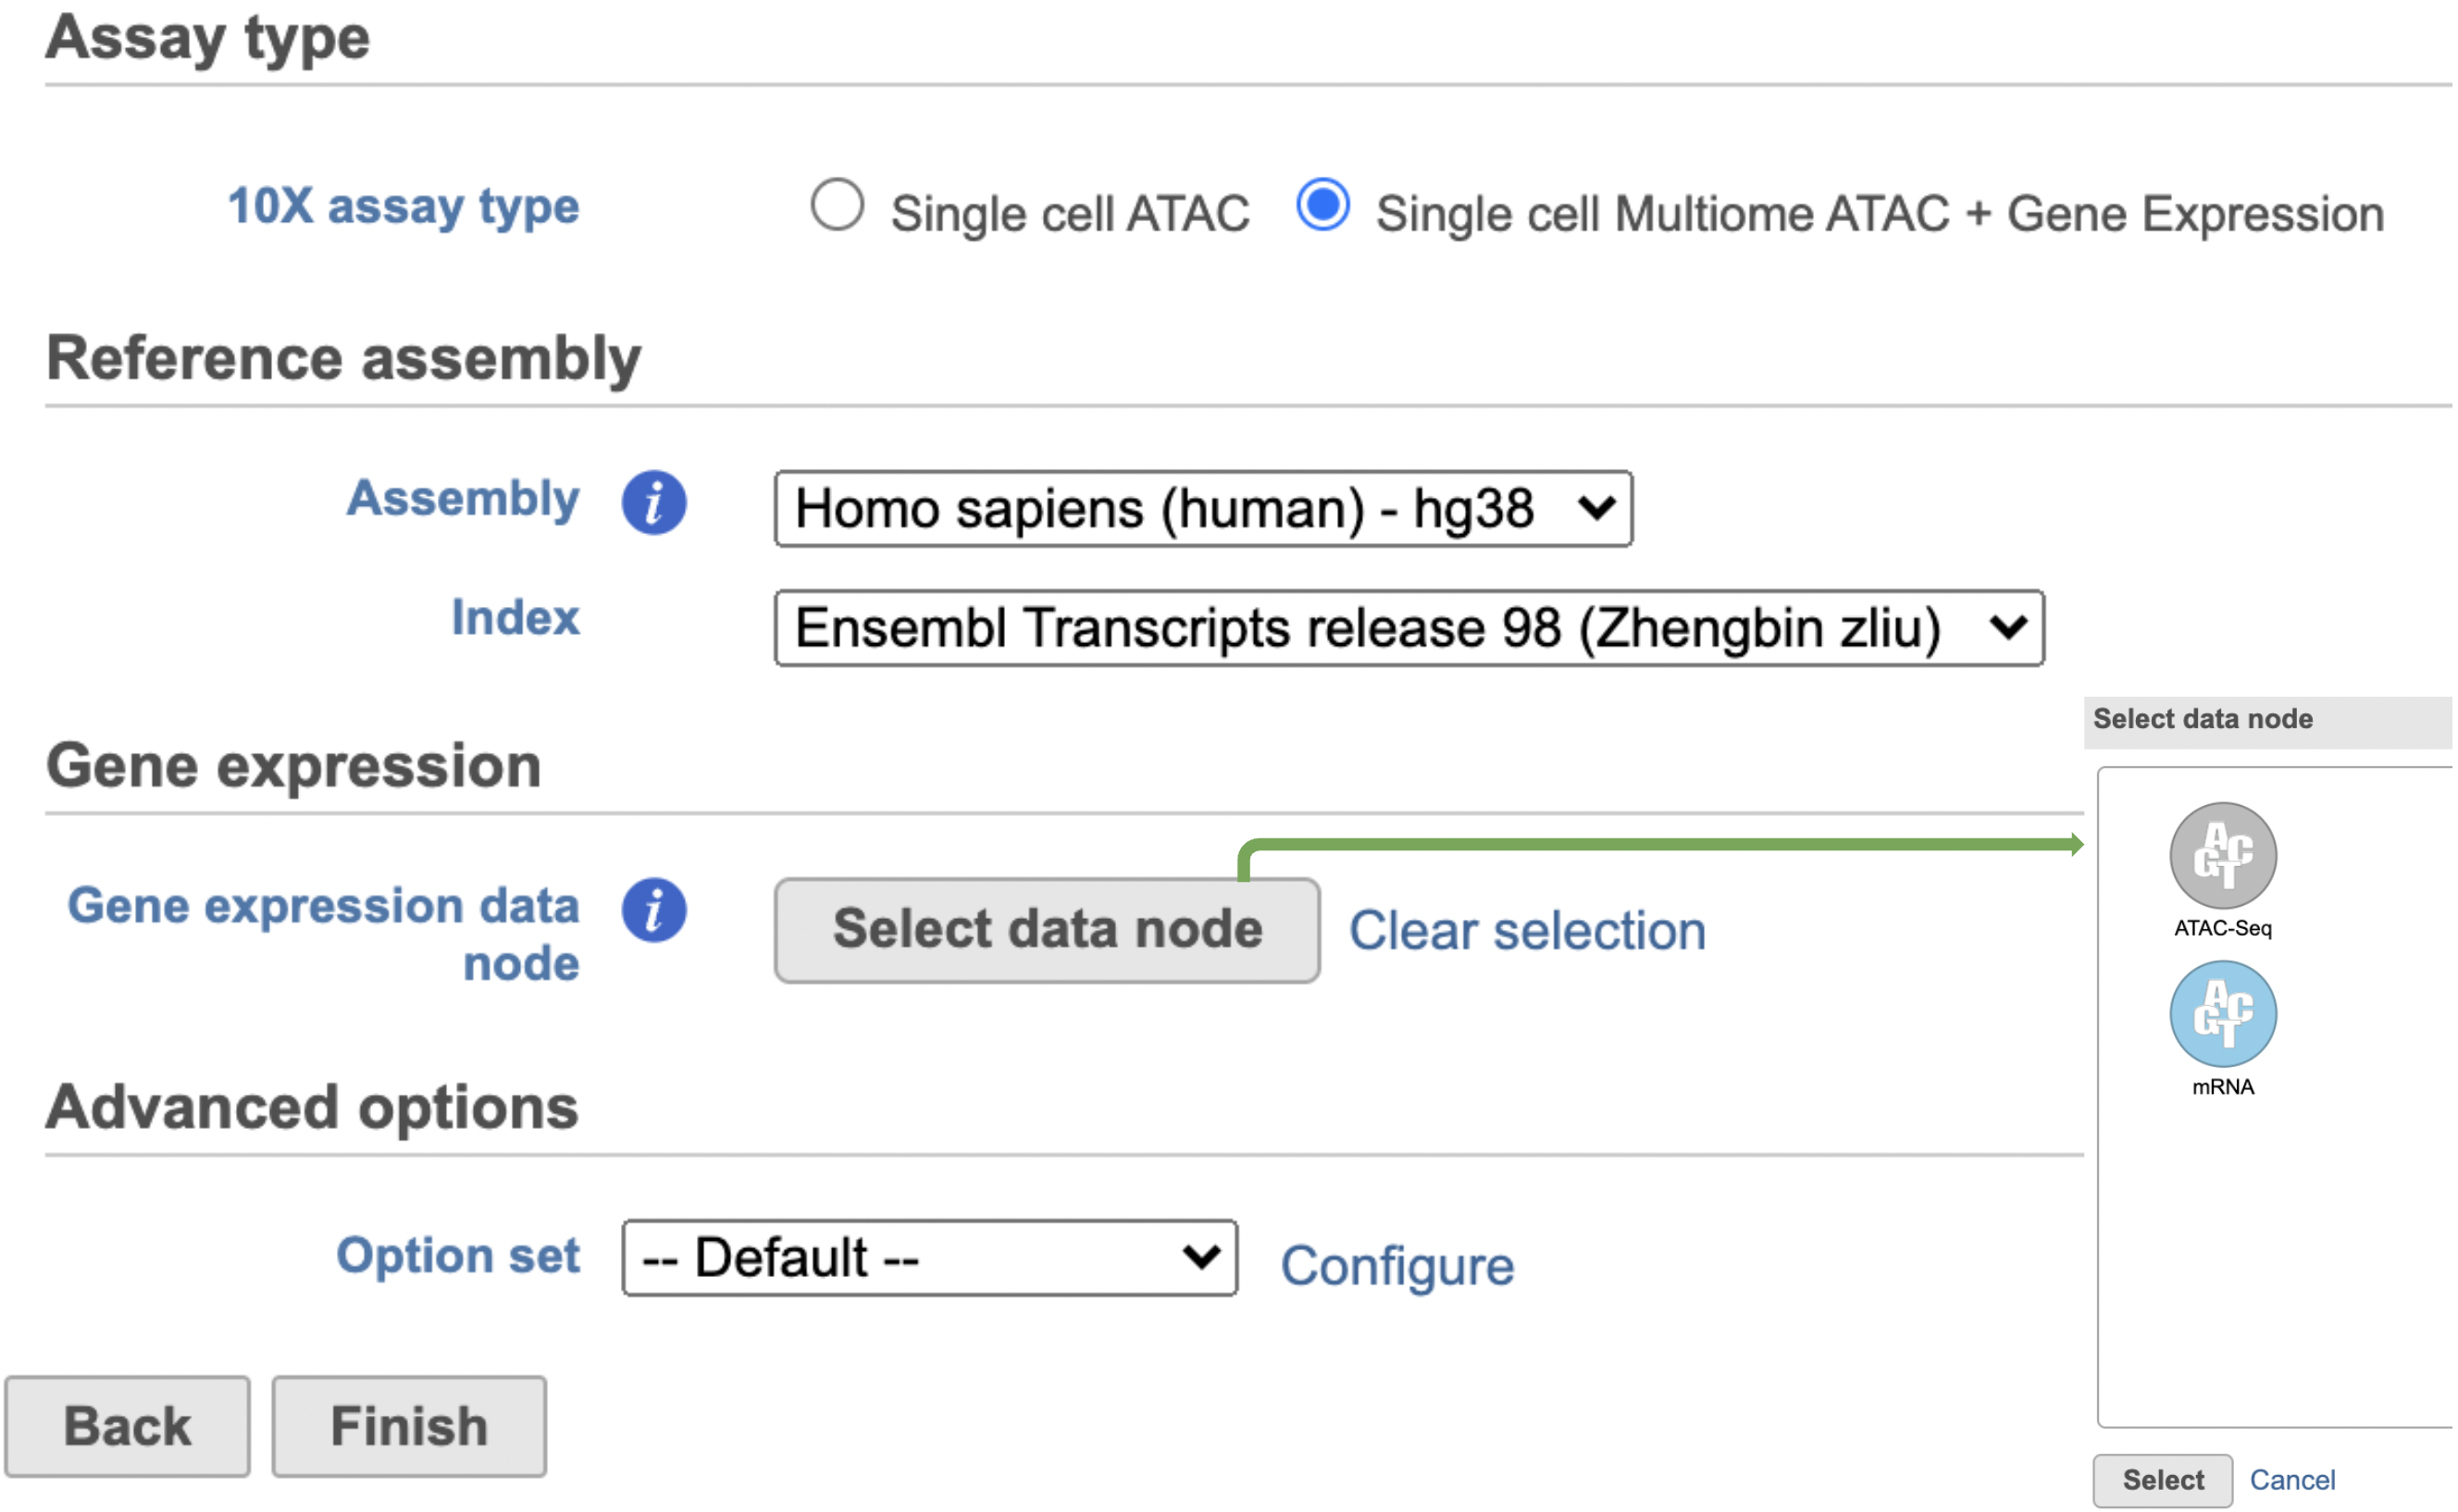
The interface will be different for Single Cell Multiome ATAC + Gene Expression sequencing data because the gene expression data from the very same cell has to be paired with the ATAC-Seq data (Figure 3)
| Numbered figure captions | ||||||
|---|---|---|---|---|---|---|
| ||||||
|
A new data node named Single cell counts will will be displayed in Flow if the task has been finished successfully (Figure 34). This data node contains a filtered peak barcode count matrix . To for ATAC-Seq data, but a unified feature-barcode matrix that contains gene expression counts alongside ATAC-Seq peak counts for each cell barcode for multiomic data. To open the task report when the task is finished, double click the output data node, or select the Task report in in the Task results section after single clicking the data node. Users then will find the task report (Figure 4) is the same to as the ‘Summary HTML’ from Cell Ranger ATAC output.
| Numbered figure captions | ||||
|---|---|---|---|---|
| ||||
|
Cell Ranger - ATAC task report in Flow
Task report is sample based. Users can use the dropdown list on the top left to switch samples. Under the sample name, there are two tabs on each report - Summary report and Data Quality report (Figure 45). Important information on Estimated Number of Cells, Median high-quality fragments per cell, Fraction of high-quality fragments overlapping peaks, as well as information on Sample, Sequencing, Cells and Cell Clustering are summarized in different panels. The Barcode Rank plot and the Fragment Distribution plot have also been included as an important piece in the Cells section in the Summary report (Figure 45). Descriptions of metrics in the following sections can also be found by clicking the ![]() to the section header in the Summary HTML file itself.
to the section header in the Summary HTML file itself.
...
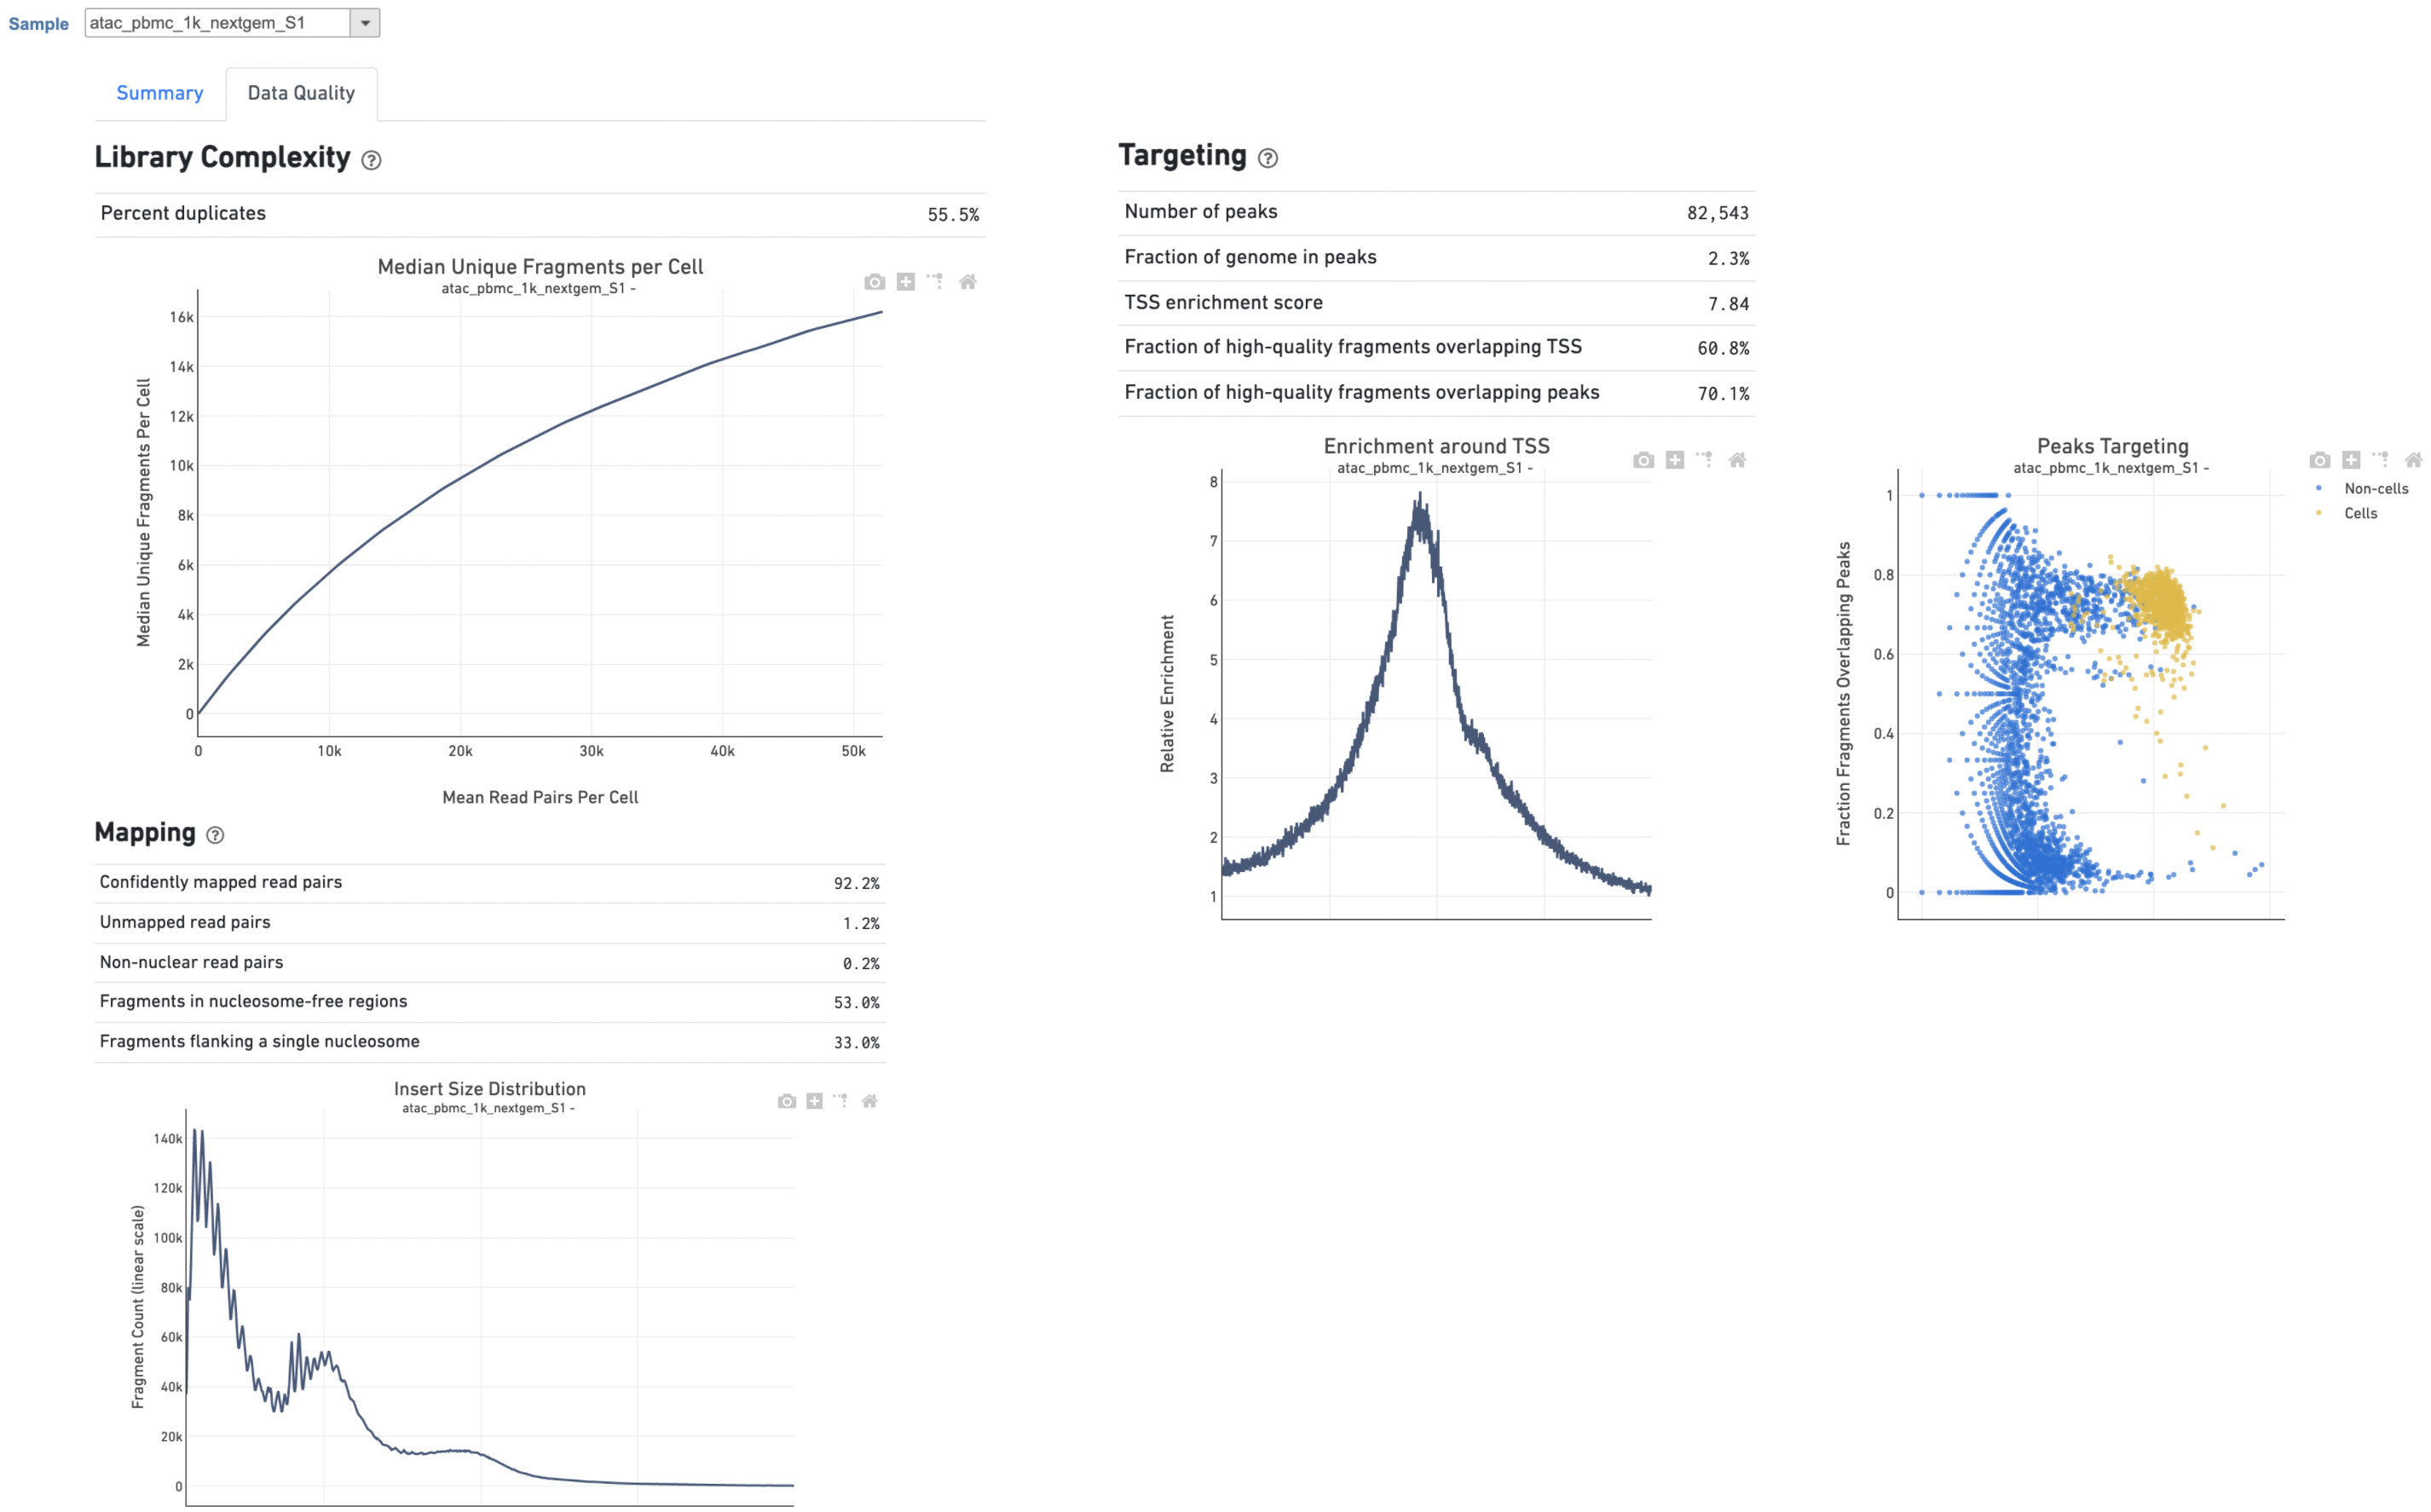
The Library Complexity section in Data Quality report plots the observed per cell complexity, measured as median unique fragments per cell, as a function of mean reads per cell. (Figure 56). While the Mapping section displays the Insert Size Distribution plot, and metrics derived from it. Single Cell ATAC read pairs produce detailed information about nucleosome packing and positioning. The fragment length distribution captures the nucleosome positioning periodicity. The Targeting section shows profiling of the chromatin accessibility behavior of the library at epigenetically relevant regions in the genome. The Enrichment around TSS plot is helpful to assess the signal-to-noise ratio of the library. It is well known that TSSs and the promoter regions around them have a higher degree of chromatin accessibility compared to the other regions of the genome. The Peaks targeting plot presents the variation in the number of on-target fragments, or fragments that overlap peaks, within each barcode group. A higher percentage of the barcode fragments overlap peaks is expected for cell-associated barcodes.
| Numbered figure captions | ||||
|---|---|---|---|---|
| ||||
|
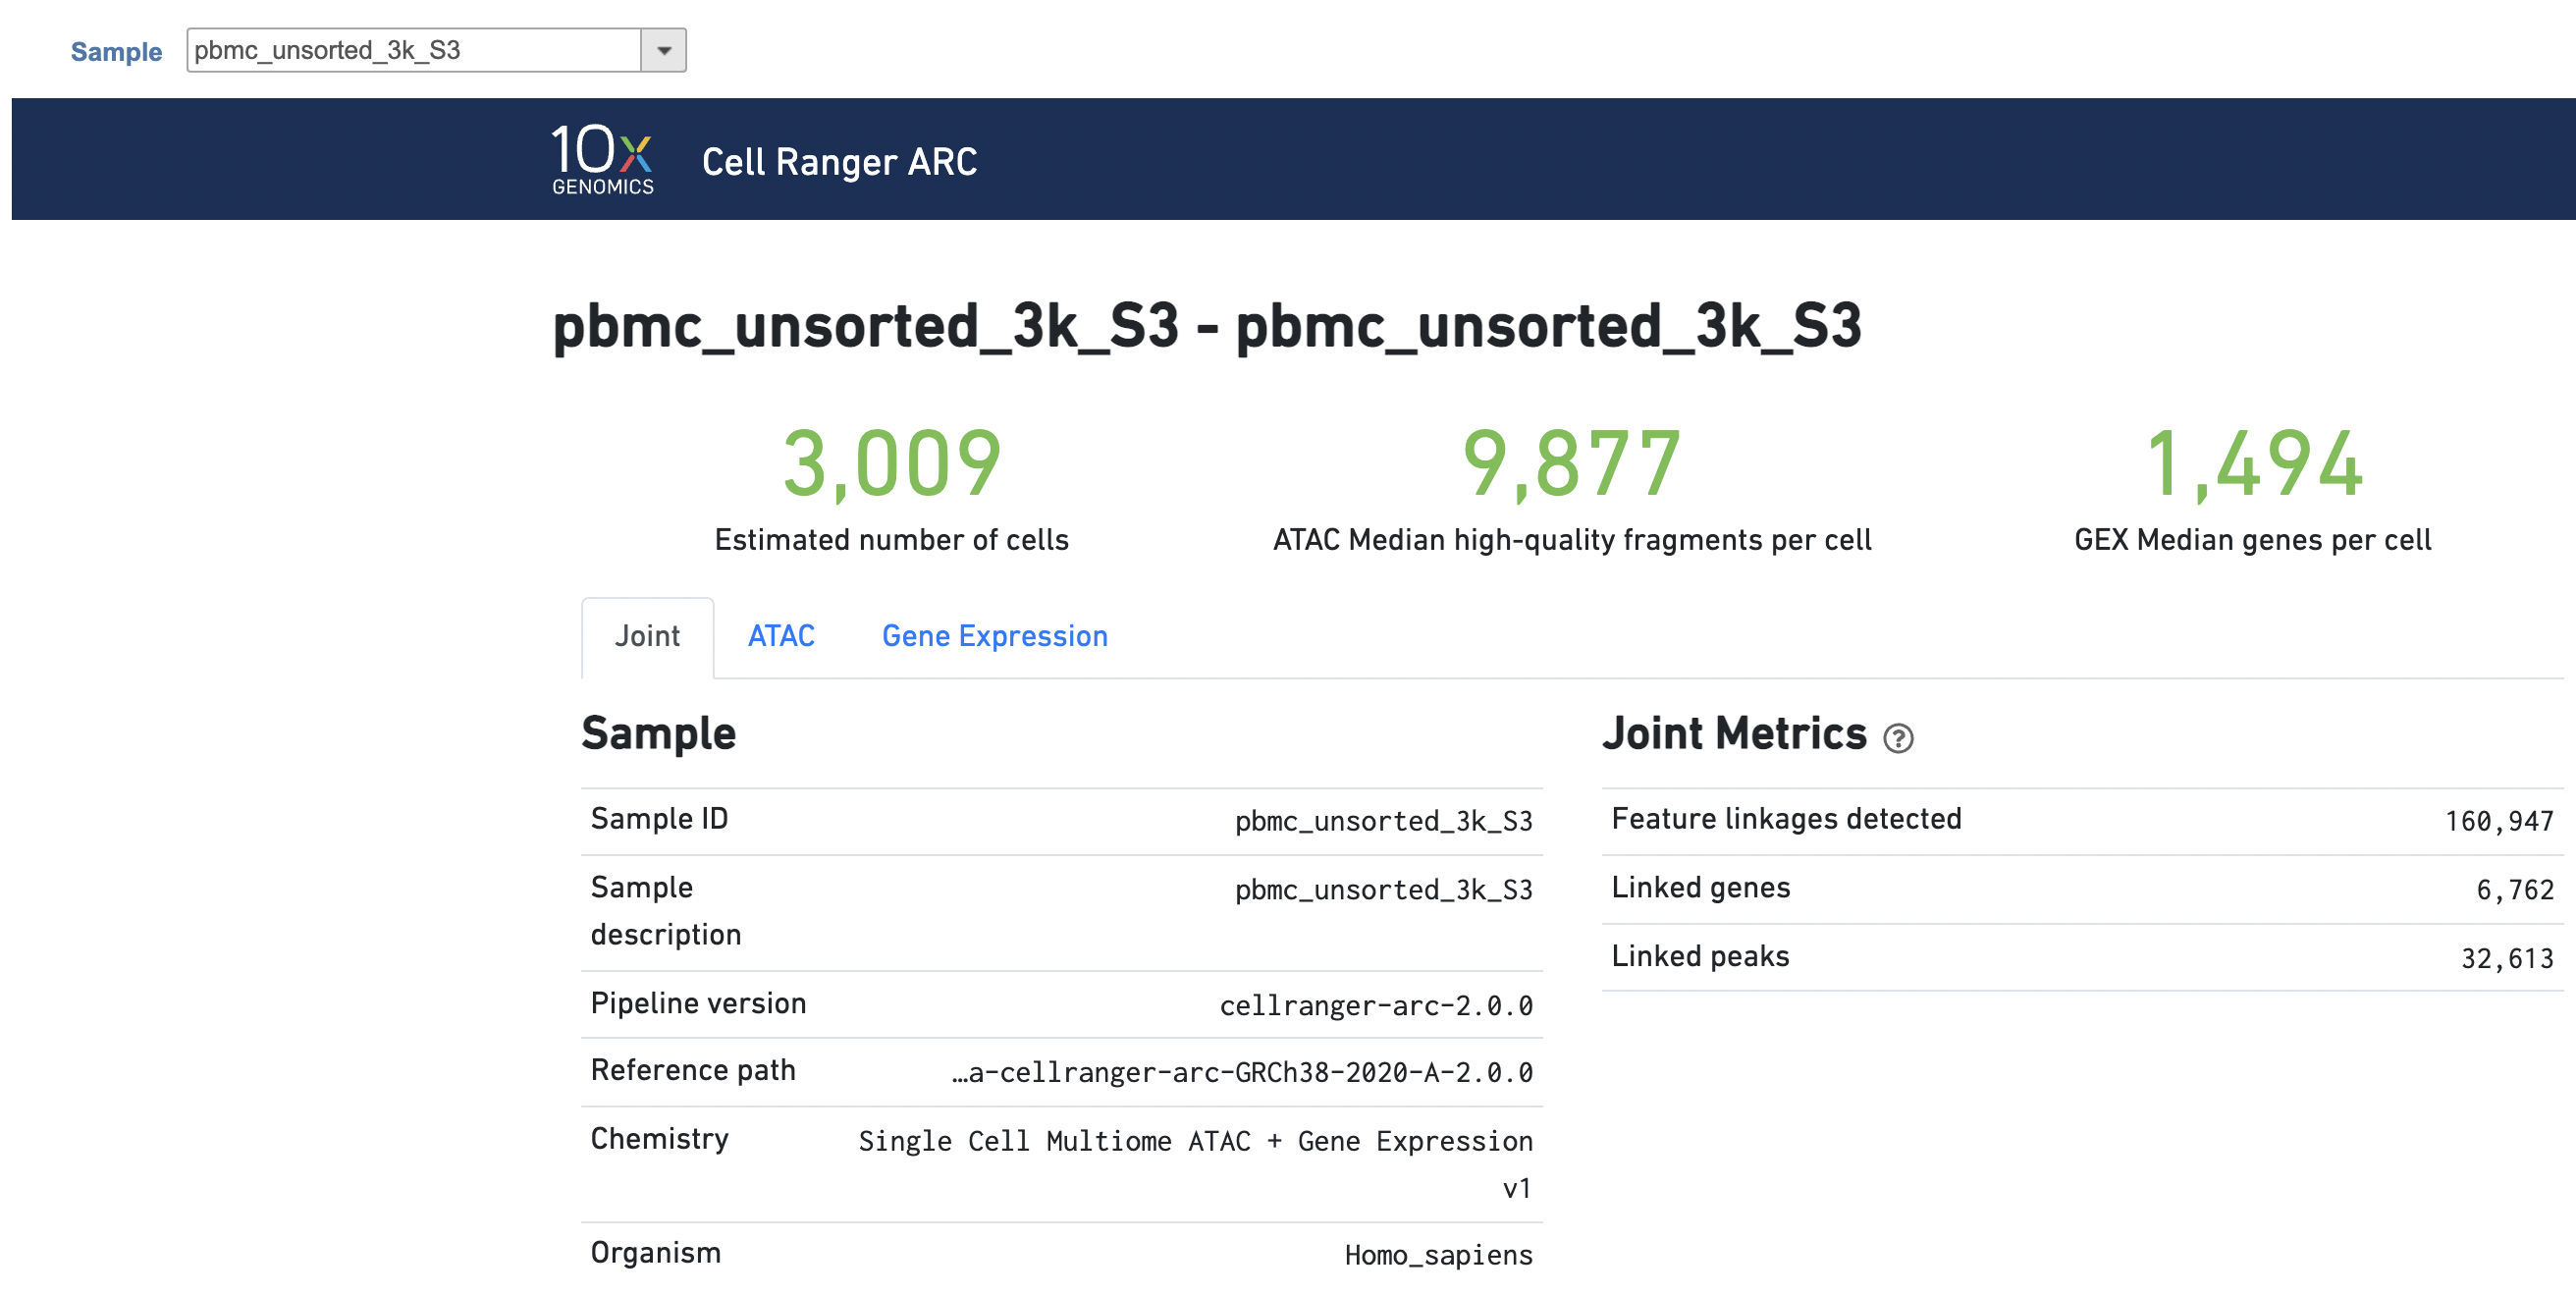
The task report for multiomic data analysis is much more complicated. It contains summary metrics at different levels - ATAC, gene expression, both/joint. Joint view is the default view visible upon first rendering the summary and can be accessed by clicking "Joint" at the top left corner. Metrics that are specific to the given Chromatin Accessibility library will appear in the ATAC tab. Lastly, metrics that are specific to the given gene expression library will appear in the Gene Expression tab (Figure 7). To understand the details, please refer to 10x Genomics webpage[4].
| Numbered figure captions | ||||
|---|---|---|---|---|
| ||||
|
Other adjustable parameters in this task (Figure 2) include:
...
https://support.10xgenomics.com/single-cell-gene-expression/software/overview/welcome
https://support.10xgenomics.com/single-cell-atac/software/pipelines/latest/release-notes
- https://support.10xgenomics.com/single-cell-multiome-atac-gex/software/pipelines/latest/what-is-cell-ranger-arc
- https://support.10xgenomics.com/single-cell-multiome-atac-gex/software/pipelines/latest/output/summary
Additional Assistance
If you need additional assistance, please visit our support page to submit a help ticket or find phone numbers for regional support.
Overview
Content Tools