Page History
...
| Numbered figure captions | ||||
|---|---|---|---|---|
| ||||
|
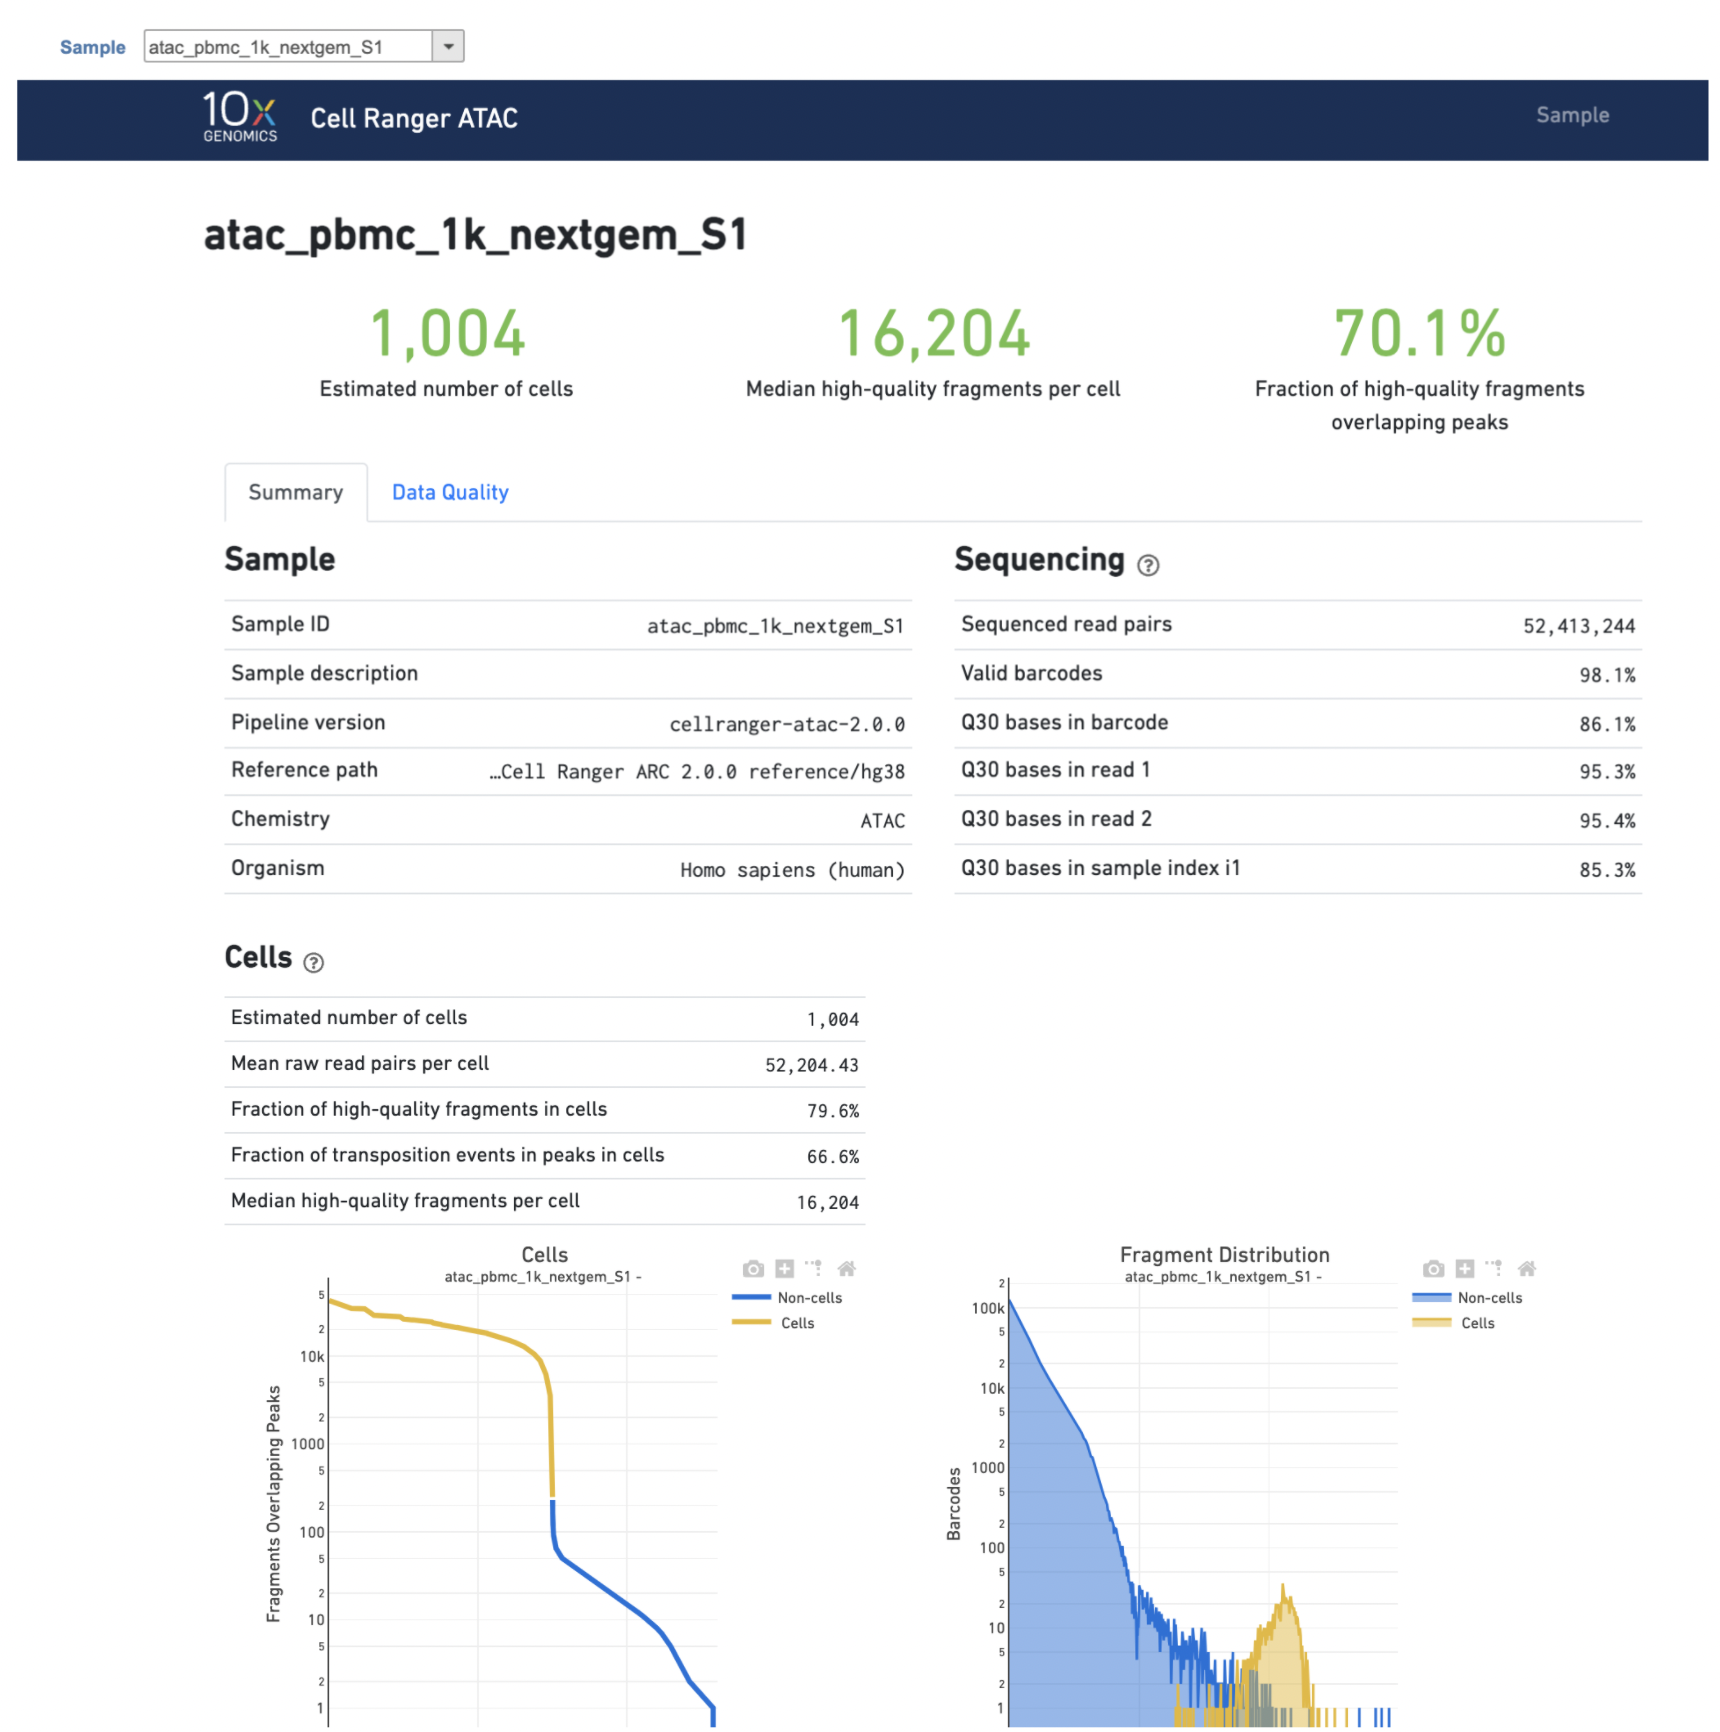
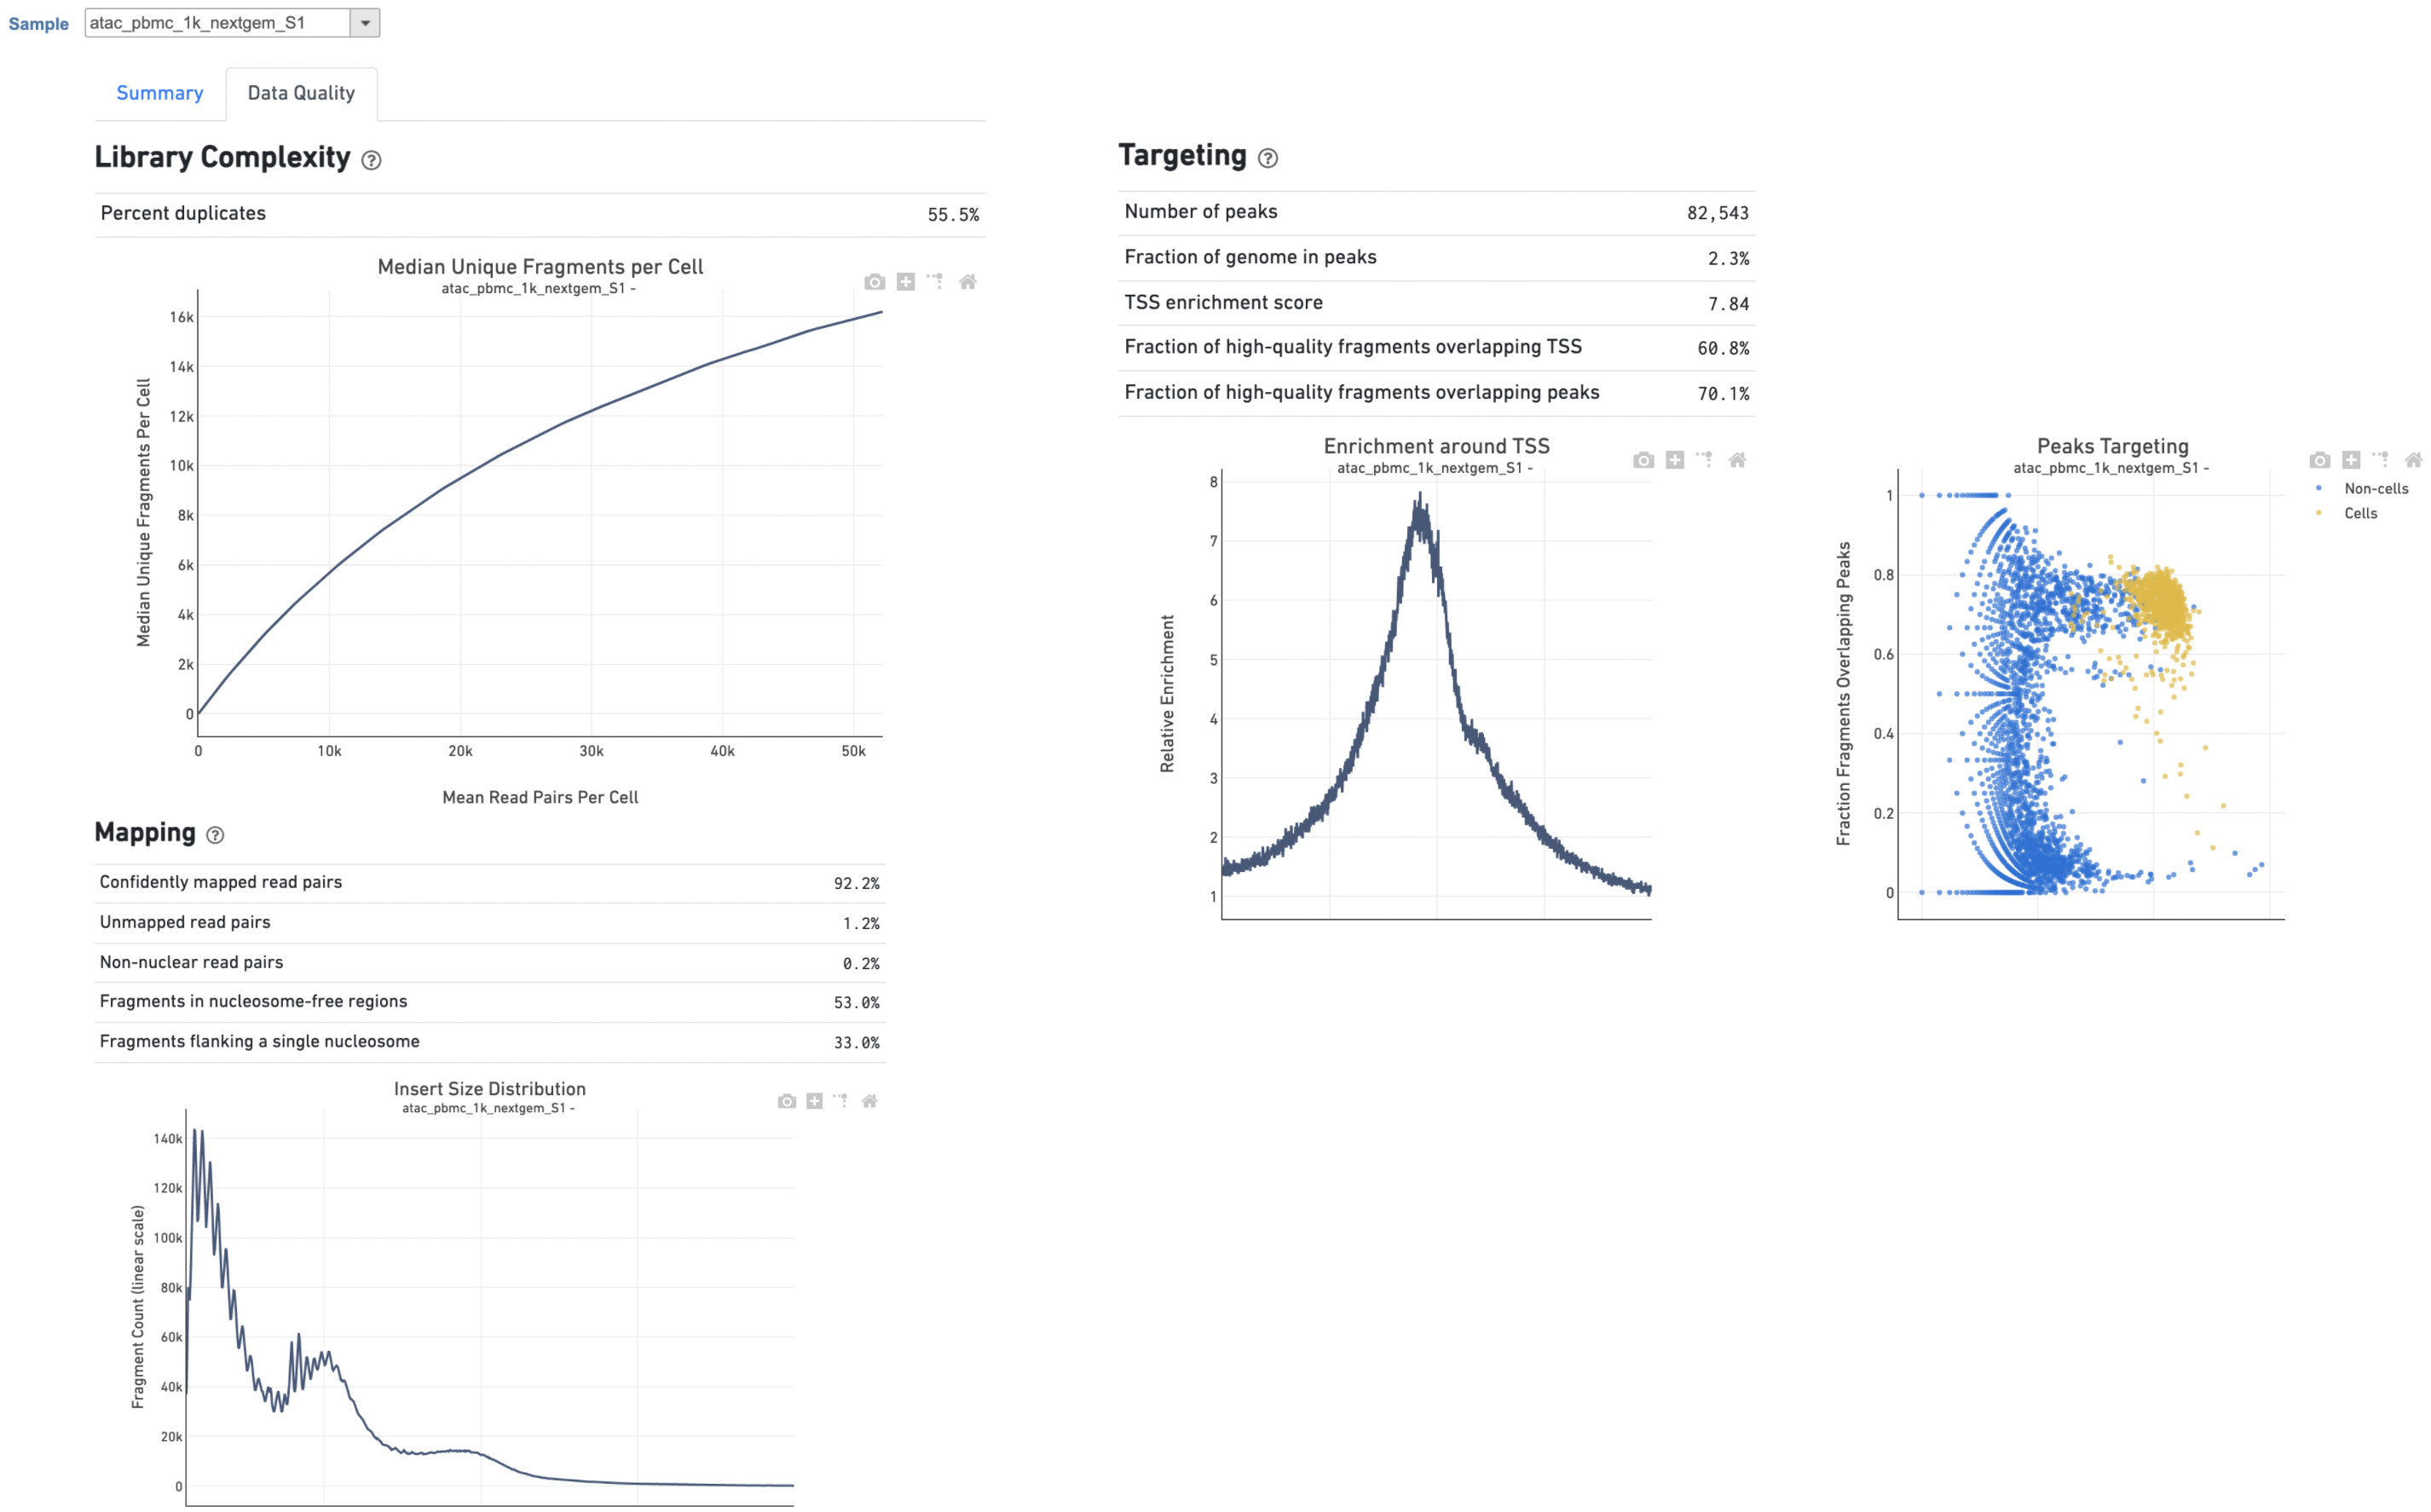
Another two plots -biplots of Sequencing Saturation and Median Genes per Cell to Mean Reads per Cell have been included in the Analysis report as they are important metrics to library complexity and sequencing depth (Figure 5).The Library Complexity section in Data Quality report plots the observed per cell complexity, measured as median unique fragments per cell, as a function of mean reads per cell. (Figure 5). WhileIn the Mapping section displays the Insert Size Distribution plot, and metrics derived from it. Single Cell ATAC read pairs produce detailed information about nucleosome packing and positioning. The fragment length distribution captures the nucleosome positioning periodicity. The Targeting section shows profiling of the chromatin accessibility behavior of the library at epigenetically relevant regions in the genome. The Enrichment around TSS plot is helpful to assess the signal-to-noise ratio of the library. It is well known that TSSs and the promoter regions around them have a higher degree of chromatin accessibility compared to the other regions of the genome. The Peaks targeting plot presents the variation in the number of on-target fragments, or fragments that overlap peaks, within each barcode group. A higher percentage of the barcode fragments overlap peaks is expected for cell-associated barcodes.
| Numbered figure captions | ||||
|---|---|---|---|---|
| ||||
|
...
Overview
Content Tools