Page History
...
| Numbered figure captions | ||||
|---|---|---|---|---|
| ||||
|
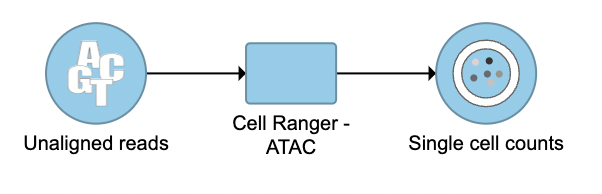
Cell Ranger -
...
ATAC task report in Flow
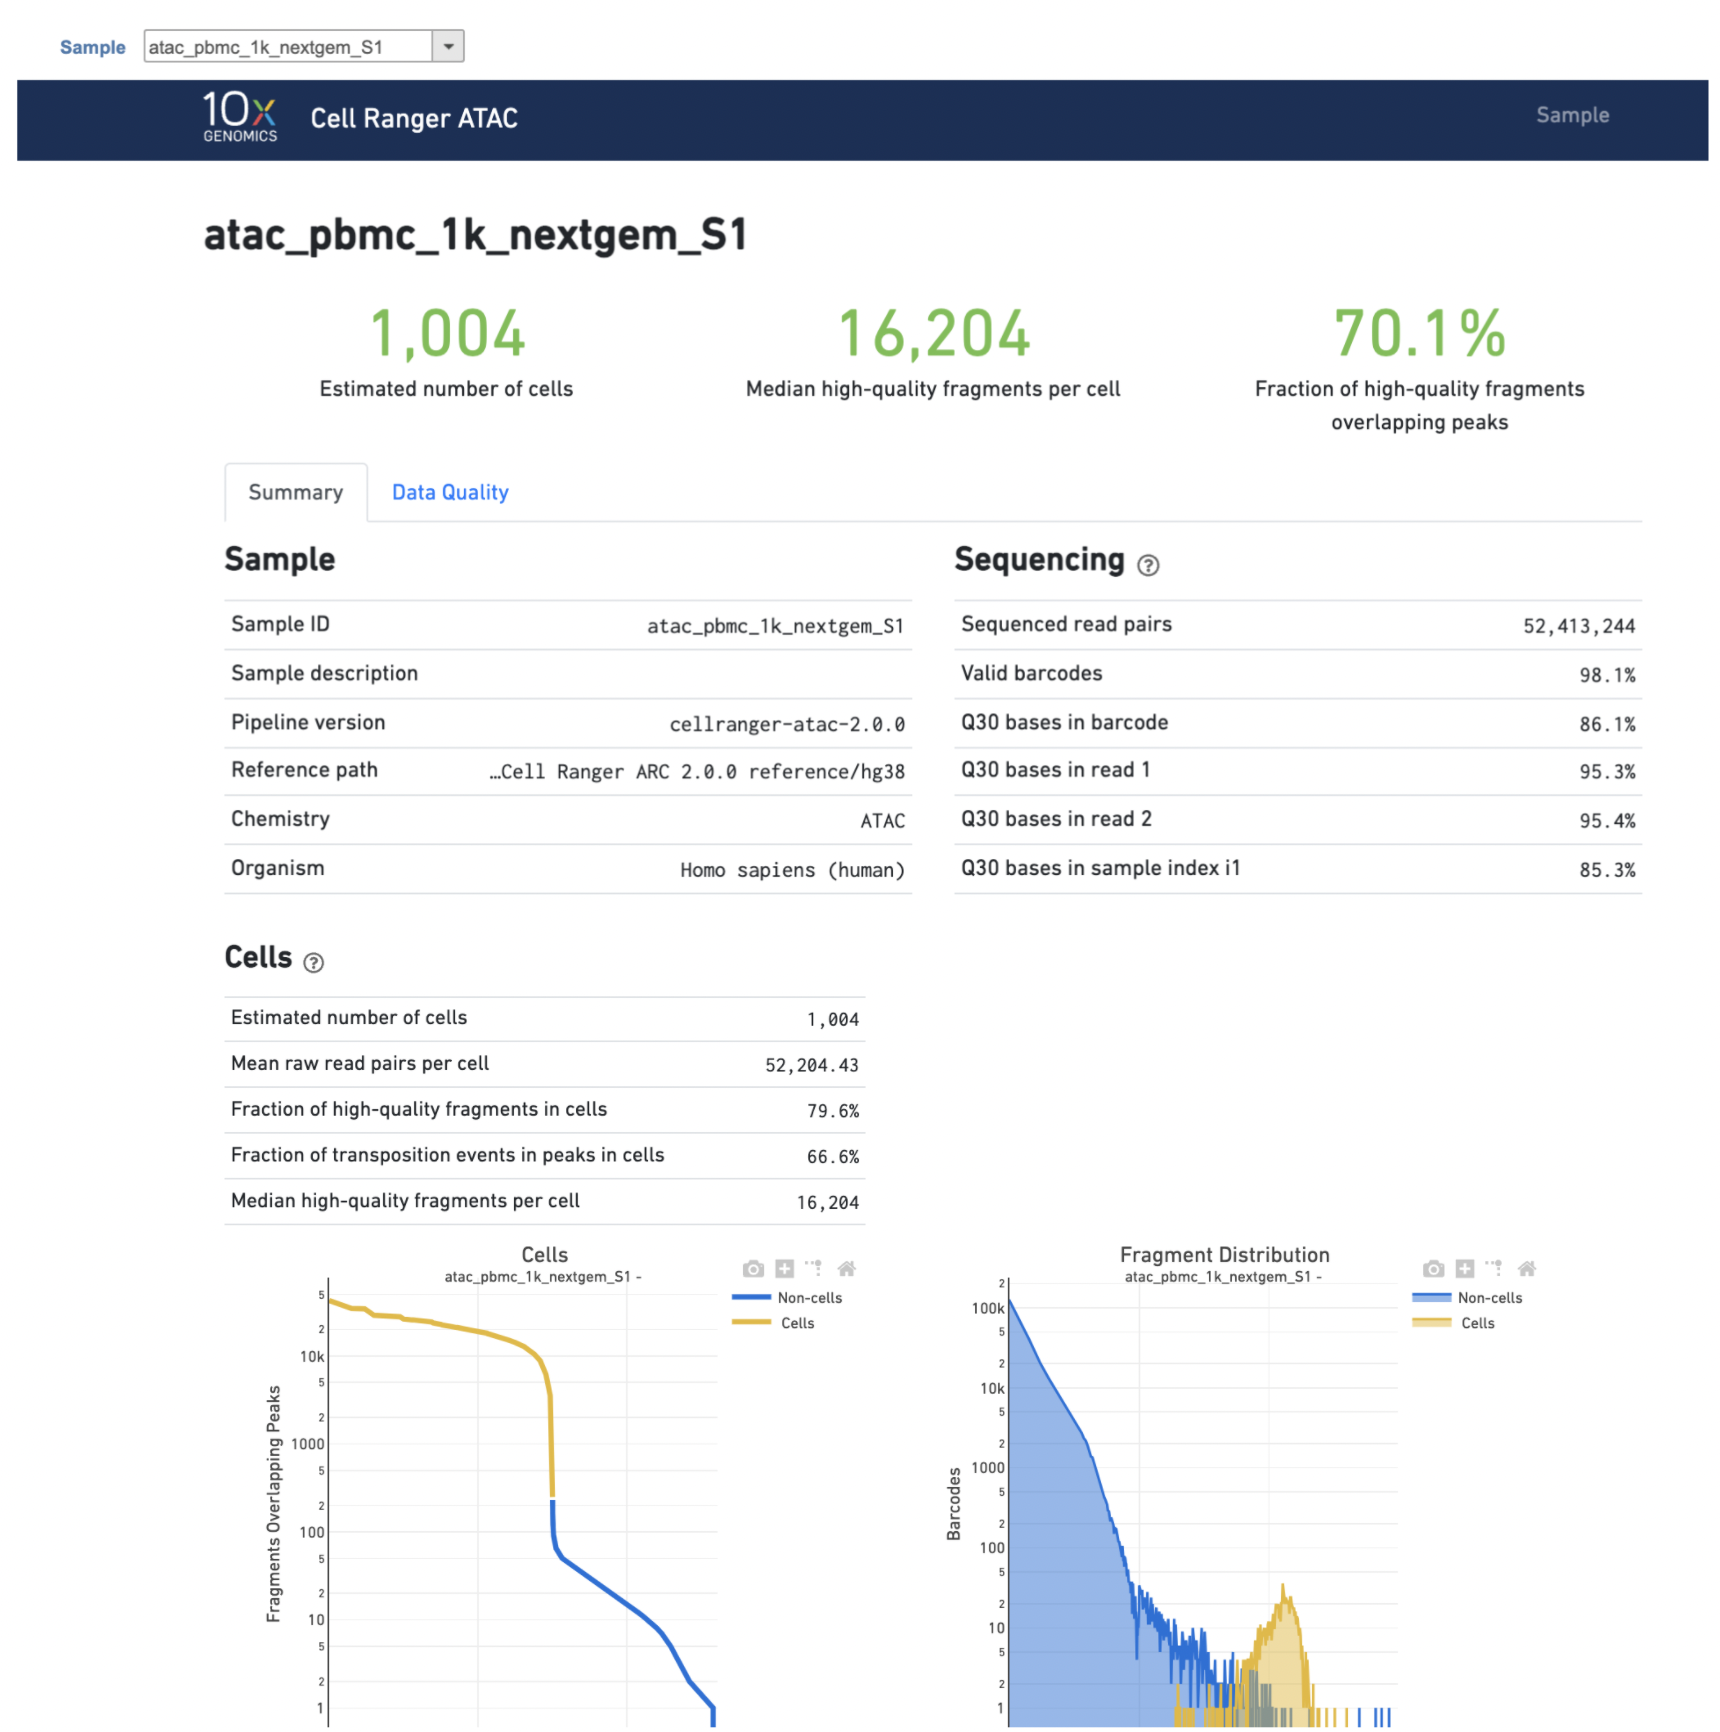
Task report is sample based. Users can use the dropdown list on the top left to switch samples. Under the sample name, there are two tabs on each report - Summary report and Analysis report Data Quality report (Figure 74). Important information on Estimated Number of Cells, Mean Reads per Cell, Median Genes per Cell, Median high-quality fragments per cell, Fraction of high-quality fragments overlapping peaks, as well as information on on Sample, Sequencing, Mapping, and Sample Cells and Cell Clustering are summarized in different panels. The Barcode Rank Plot has plot and Fragment Distribution plot have also been included as an important piece in the Cells panel in the Summary report (Figure 74). Descriptions of metrics in the following sections can also be found by clicking the ![]() to the section header in the Summary HTML file itself.
to the section header in the Summary HTML file itself.
| Numbered figure captions | ||||
|---|---|---|---|---|
| ||||
|

Another two plots -biplots of Sequencing Saturation and Median Genes per Cell to Mean Reads per Cell have been included in the Analysis report as they are important metrics to library complexity and sequencing depth (Figure 85).
| Numbered figure captions | ||||
|---|---|---|---|---|
| ||||
|

Details will be exhibited and the panel will be expanded correspondingly if the the ![]() icon is clicked. In the example below, the plot of Median Genes per Cell has been expanded while the Sequencing Saturation plot hasn't (Figure 9).
icon is clicked. In the example below, the plot of Median Genes per Cell has been expanded while the Sequencing Saturation plot hasn't (Figure 9).
| Numbered figure captions | ||||
|---|---|---|---|---|
| ||||
|

Other than two additional panels summarized information for Antibody Sequencing and Antibody Application have been added, the task report for Feature Barcode data is the same to scRNA-seq data report.
| Numbered figure captions | ||||
|---|---|---|---|---|
| ||||
|

Users can click Configure to change the default settings In Advanced options (Figure 4).
...
Overview
Content Tools