Page History
...
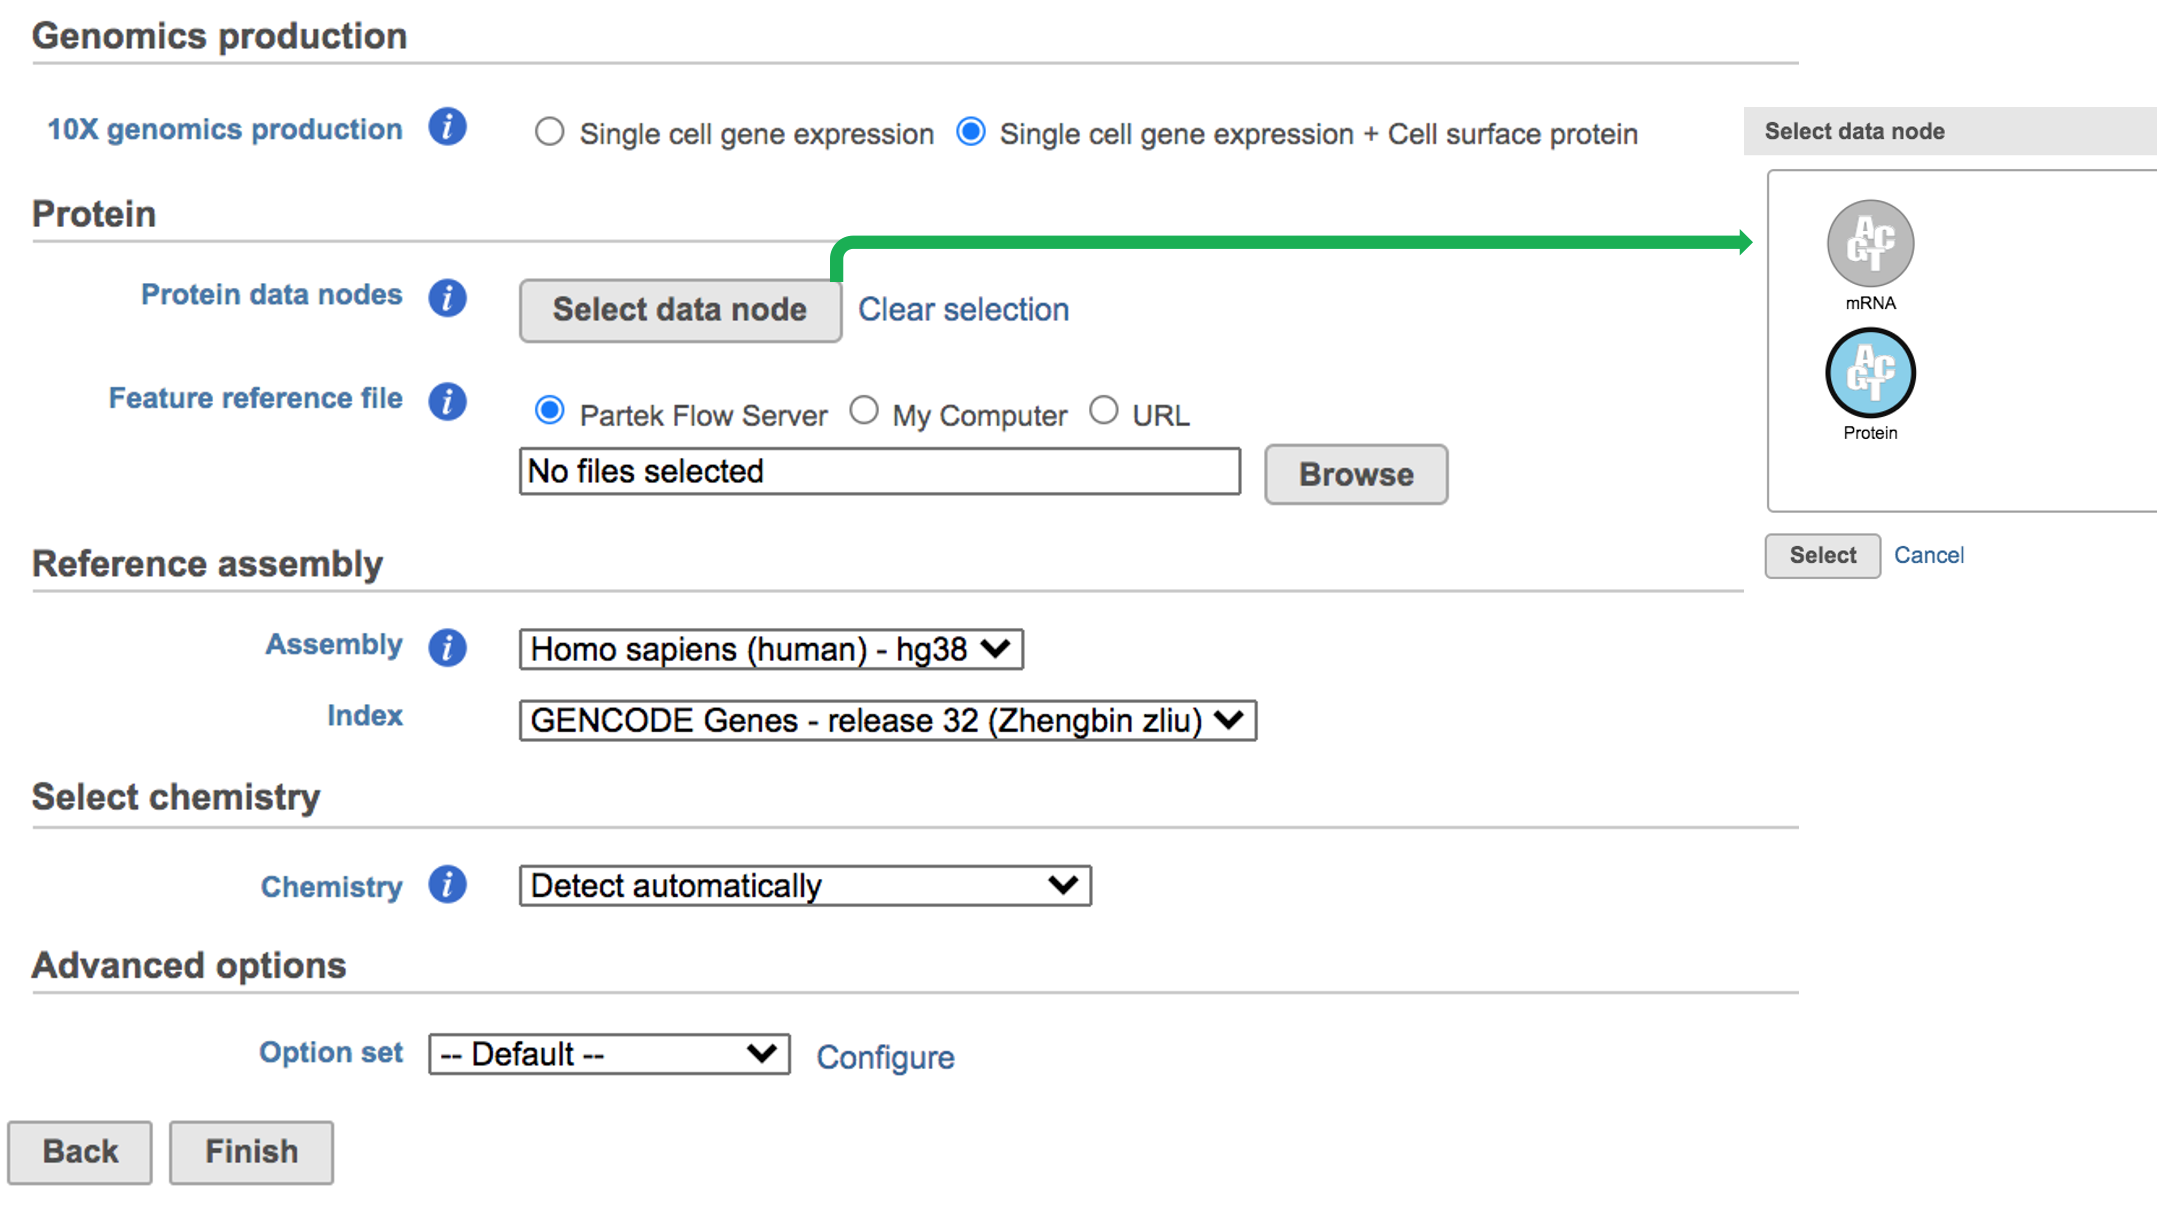
While for Feature Barcode data, there are more information needed besides reference assembly. An additional section of Protein has been added to the interface if Single cell gene expression + Cell surface protein has been selected for Feature Barcode data (Figure 5). Firstly, Users need firstly push the button Select data node and select the correct data for feature of antibody capture or protein in the newly popped-out window (top right, Figure 5). Then users need to upload the feature reference file (.csv) prepared by users for their datasets. A Feature Reference CSV file declares the molecule structure and unique Feature Barcode sequence of each feature present in your the experiment. It should include at least six columns: id, name, read, pattern, sequence and feature_type. An example of TotalSeq™-B Feature Reference CSV has been linked here. But for more details, please refer to 10x Genomics webpage[4].
| Numbered figure captions | ||||
|---|---|---|---|---|
| ||||
|
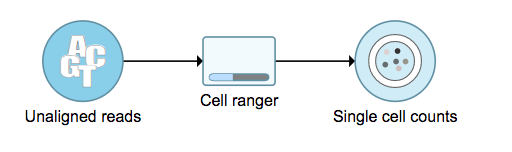
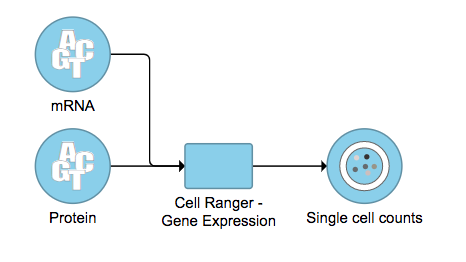
A new data node named ‘Single cell counts’ will be displayed in Flow if the task is running has been finished successfully (Figure 6). This data node contains a filtered feature barcode count matrix for gene expression data, but a unified feature-barcode matrix that contains gene expression counts alongside Feature Barcode counts for each cell barcode for Feature Barcode data. To open the task report when the task is finished, double click the output data node, or select the ‘Task report’ in the section after single clicking the data node. Users then will find the task report (Figure 7) is the same to the ‘Summary HTML’ from Cell Ranger output.
| Numbered figure captions | ||||
|---|---|---|---|---|
| ||||
|
Cell Ranger - Gene Expression task report in Flow
...
Overview
Content Tools