Page History
...
| Numbered figure captions | ||||
|---|---|---|---|---|
| ||||
|


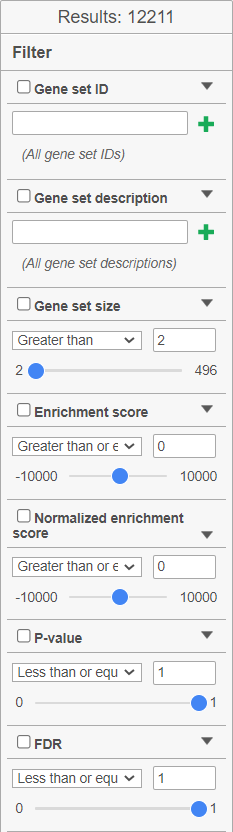
The report consists of two parts: the GSEA result table on the right and the filter panel on the left (Figure 9).
...
| Numbered figure captions | ||||
|---|---|---|---|---|
| ||||
|
Click on the View enrichment report icon (![]() ) to open a new Data viewer session with the per-gene set report. The current gene set is in the title, at the top of the canvas (Enrichment profile). To quickly switch to another gene set, use the Configuration > Content > Data card in the menu (on the left). The individual plots are as follows (Figure 11; from top to bottom).
) to open a new Data viewer session with the per-gene set report. The current gene set is in the title, at the top of the canvas (Enrichment profile). To quickly switch to another gene set, use the Configuration > Content > Data card in the menu (on the left). The individual plots are as follows (Figure 11; from top to bottom).
...
Overview
Content Tools