Page History
...
| Numbered figure captions | ||||
|---|---|---|---|---|
| ||||
|

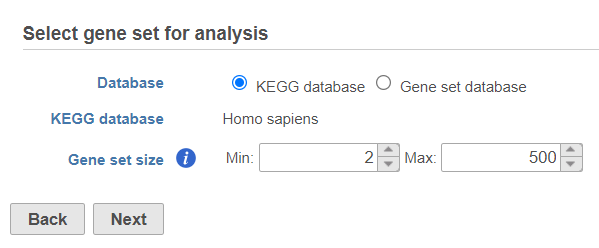
Use the first dialog (Figure 2) to specify gene sets. You can run GSEA on pathways (currently based on Kyoto Encyclopedia of Genes and Genomse Genomes (KEGG) pathways) or on other gene set databases. When using the KEGG option, the KEGG database (i.e. the species) is automatically set, based on the upstream nodes. The Gene set size option allows you to restrict your analysis on gene sets of certain size (i.e. number of genes).
...
| Numbered figure captions | ||||
|---|---|---|---|---|
| ||||
|
If you select Gene set database, two additional options will appear. Genome build will be detected automatically, based on the upstream nodes. The gene sets that are available for that build are listed in the drop down list (Figure 3). Custom databases will be labeled by their name as specified in the Library file management, while GO database will be labeled by the release date (as seen in Figure 3).
...
| Numbered figure captions | ||||
|---|---|---|---|---|
| ||||
|
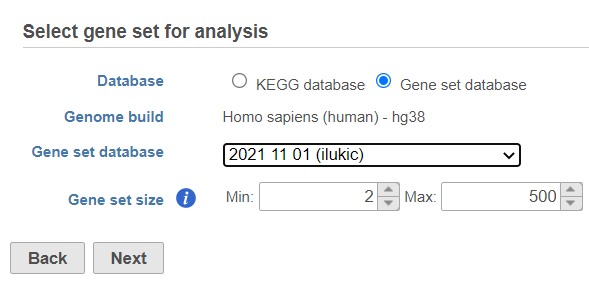
Once your choices are made, push Next to proceed.
...
| Numbered figure captions | ||||
|---|---|---|---|---|
| ||||
|
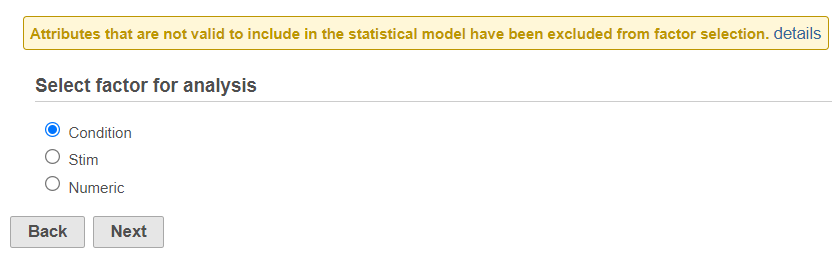
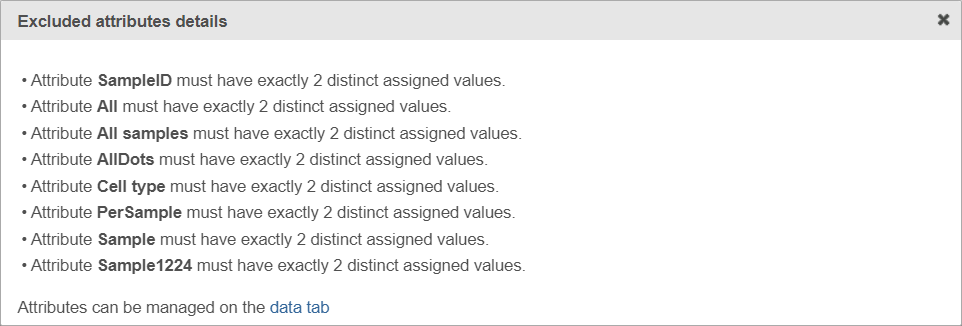
If the warning message is displayed, click on the details link to learn more about unavailable factors (an example is shown in Figure 5).
...
| Numbered figure captions | ||||
|---|---|---|---|---|
| ||||
|
Select the experimental factor that you want to run GSEA on and push Next.
...
| Numbered figure captions | ||||
|---|---|---|---|---|
| ||||
|
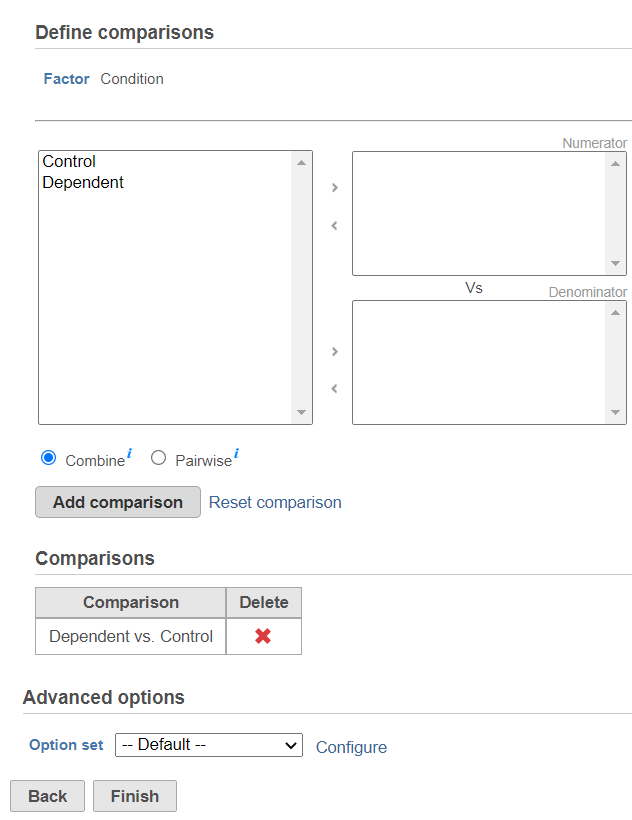
Push Finish to launch GSEA with the default settings.
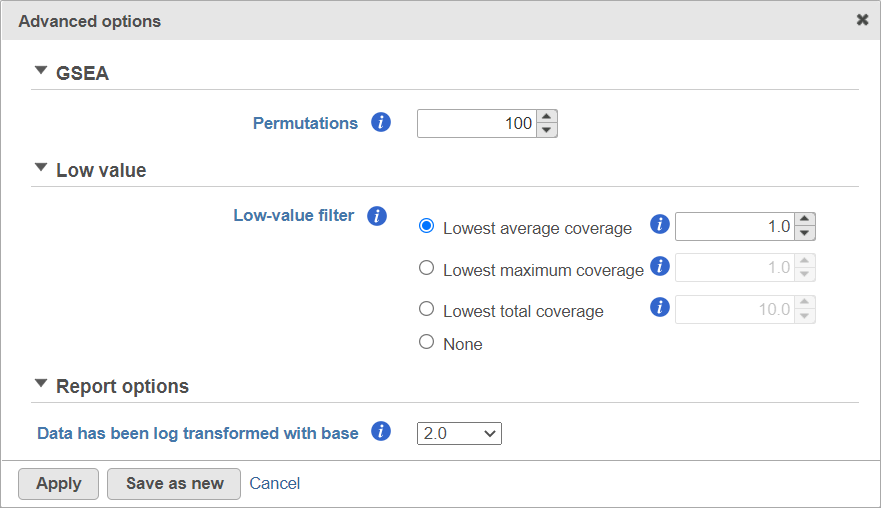
Alternatively, click on the Configure icon to access the advanced options (Figure 7). Number of data permutations (needed to calculate the normalised enrichment scores) can be controlled using the Permutations option. Low value filter is turned on by default and will remove all the genes with the lowest average coverage of 1.0 or below; if a filter feature task was performed before this task, the default low-value filter is set to None (for details please see the GSA chapter) . Finally, if you start your project by importing a count matrix (i.e. as opposed to generating the count matrix using Partek Flow), you need to specify whether the expression values were log transformed before the import (use the Data has been log transformed with base drop down).
...
| Numbered figure captions | ||||
|---|---|---|---|---|
| ||||
|
GSEA Results
...
| Numbered figure captions | ||||
|---|---|---|---|---|
| ||||
|


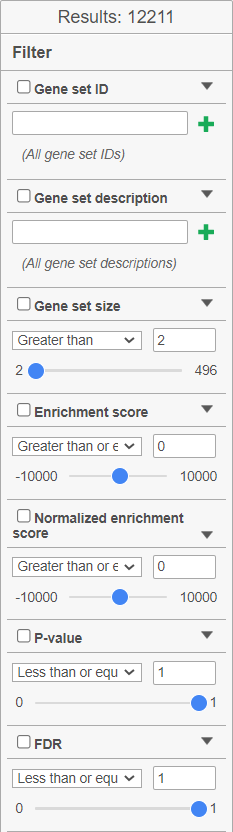
The report consists of two parts: the GSEA result table on the right and the filter panel on the left (Figure 9).
...
| Numbered figure captions | ||||
|---|---|---|---|---|
| ||||
|
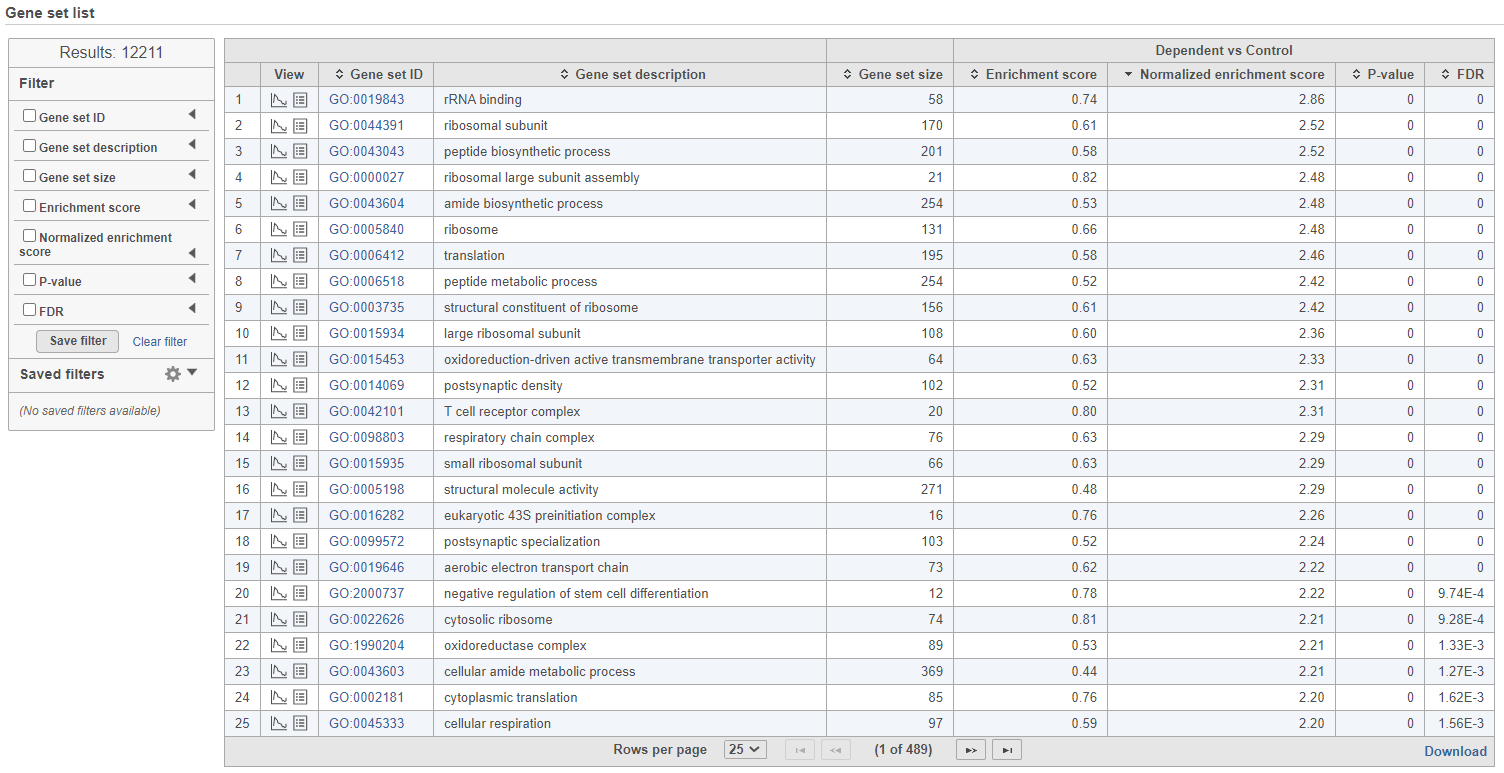
The comparison (i.e. Denominator vs. Numerator) is given at the top of the GSEA table. To download the table to your local computer as a text file, use the Download link in the bottom right. Each row of the table corresponds to one gene set and the gene sets are ranked by the P-value, ascending (lowest values at the top). The carrets icon (![]() ) in the column headers are used for sorting. The columns of the table are as follows.
) in the column headers are used for sorting. The columns of the table are as follows.
...
| Numbered figure captions | ||||
|---|---|---|---|---|
| ||||
|
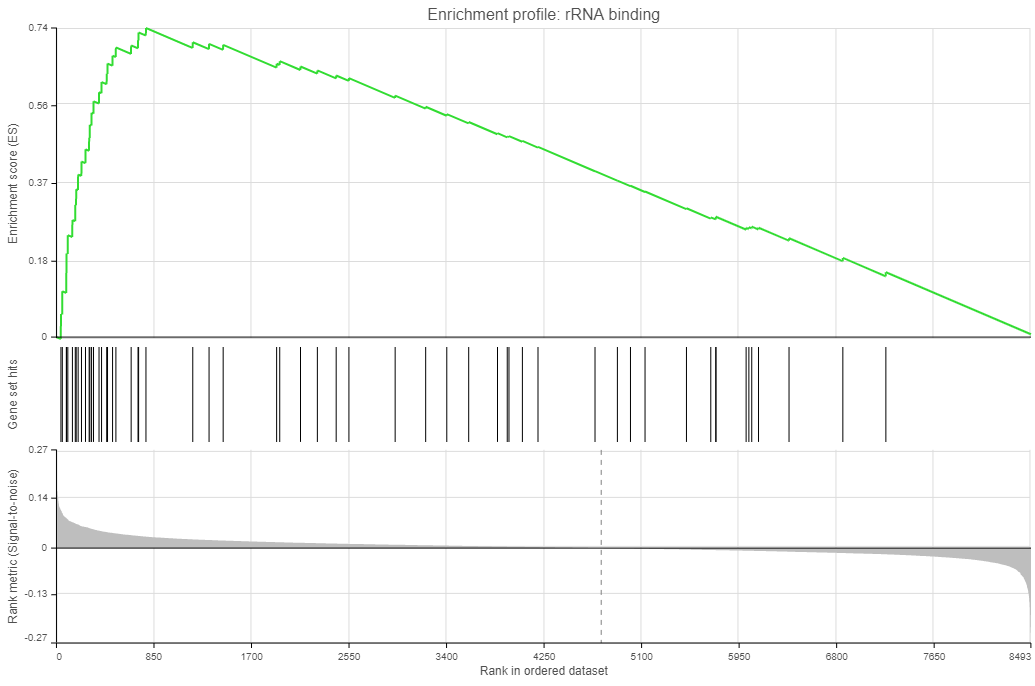
Click on the View enrichment report icon (![]() ) to open a new Data viewer session with the per-gene set report. The current gene set is in the title, at the top of the canvas (Enrichment profile). To quickly switch to another gene set, use the Configuration > Content > Data card in the menu (on the left). The individual plots are as follows (Figure 11; from top to bottom).
) to open a new Data viewer session with the per-gene set report. The current gene set is in the title, at the top of the canvas (Enrichment profile). To quickly switch to another gene set, use the Configuration > Content > Data card in the menu (on the left). The individual plots are as follows (Figure 11; from top to bottom).
...
| Numbered figure captions | ||||
|---|---|---|---|---|
| ||||
|
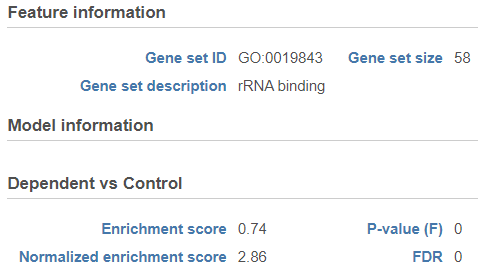
Click on the View extra details plot (![]() ) to open a gene set-specific report page (Figure 12).
) to open a gene set-specific report page (Figure 12).
...
| Numbered figure captions | ||||
|---|---|---|---|---|
| ||||
|

References
- Subramanian A, Tamayo P, Mootha VK, et al. Gene set enrichment analysis: a knowledge-based approach for interpreting genome-wide expression profiles. Proc Natl Acad Sci U S A. 2005;102(43):15545-15550. doi:10.1073/pnas.0506580102
- Mootha VK, Lindgren CM, Eriksson KF, et al. PGC-1alpha-responsive genes involved in oxidative phosphorylation are coordinately downregulated in human diabetes. Nat Genet. 2003;34(3):267-273. doi:10.1038/ng1180
Overview
Content Tools