Page History
...
Use the first dialog (Figure 2) to specify the gene sets. You can run GSEA on pathways (currently based on Kyoto Encyclopedia of Genes and Genomse (KEGG) pathways) or on other gene set databases. When using the KEGG option, the KEGG database (i.e. the species) is automatically set, based on the upstream nodes. The Gene set size options option allows you to restrict your analysis on gene sets of certain size (i.e. number of genes).
...
In the second part of the set up (Figure 4) pick the experimental factor for GSEA (three are available in this example: Condition, Stim, Numeric). The dialog will list only the factors with two categories; if your project contains additional factors, which have a single category or more than two categories, a warning message will be displayed at the top.
...
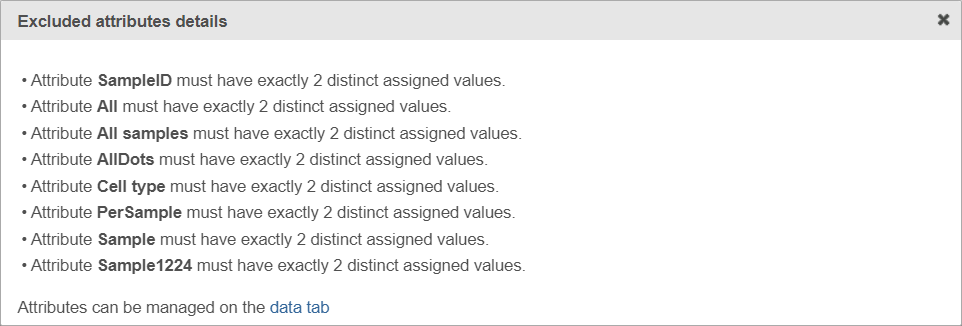
If the warning message is displayed, click on the details link to see which factors are unavailable and why (learn more about unavailable factors (an example is shown in Figure 5).
| Numbered figure captions | ||||
|---|---|---|---|---|
| ||||
|
...
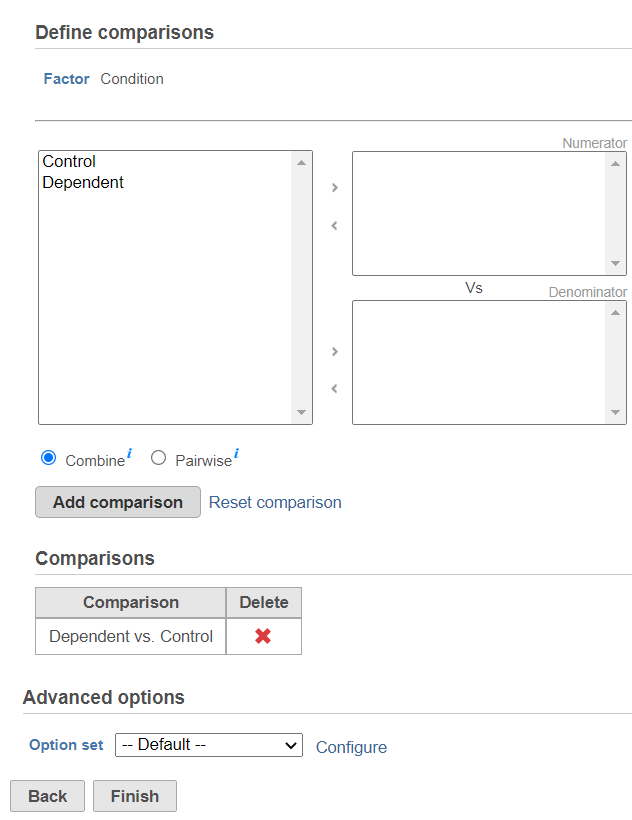
The third dialog is Define comparisons (Figure 6). The box on the left side displays the categories of the selected factor (shown as Factor). Use the arrow buttons (>) to move one of the factors to the Denominator box (that factor should be interpreted as the reference category) and the other factor to the Numerator box. Confirm your selection by pushing the Add comparison button and the comparison will be added to the Comparisons table (Figure 6).
| Numbered figure captions | ||||
|---|---|---|---|---|
| ||||
|
...
| Numbered figure captions | ||||
|---|---|---|---|---|
| ||||
|
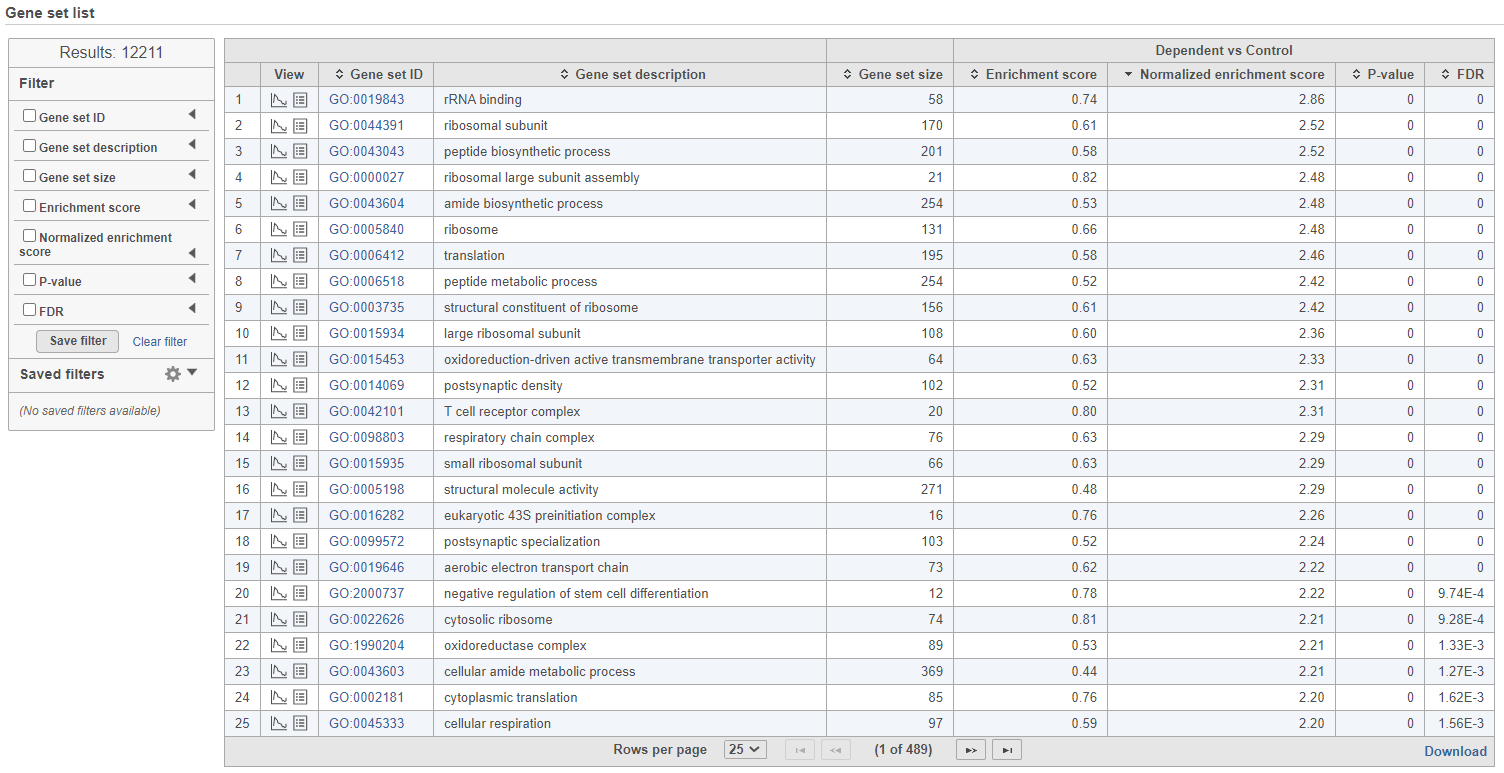
The comparison (i.e. Denominator vs. Numerator) is given at the top of the GSEA table. To download the table to your local computer as a text file, use the Download link in the bottom right. Each row of the table corresponds to one gene set and the gene sets are ranked by the P-value, ascending (lowest values at the top). The carrets (![]() ) in the column headers are used for sorting. The columns of the table are as follows.
) in the column headers are used for sorting. The columns of the table are as follows.
...
- Enrichment score. The algorithm walks down the ranked list of all the genes in the model, increasing the running sum (y axis) each time when a gene in the current gene set is encountered. Conversely, the running-sum is decreased each time a gene not in the current gene set is encountered. The magnitude of the increment depends on the correlation of the gene with the experimental factor. The enrichment score is then the maximum deviation from zero encountered in the random walk (the summit of the curve).
- Gene set hits. Each column shows the location of a gene from the current gene set, within the ranked list of all the genes in the model.
- Rank metric. The plot shows the value of the ranking metric (y axis) as you move down the ranked list of all the genes in the model (x axis). The ranking metric measures a gene’s correlation with a phenotype. A positive value of the metric indicates correlation with the first category (Numerator) and a negative value indicates correlation with the second category (Denominator).
...
Overview
Content Tools