Page History
...
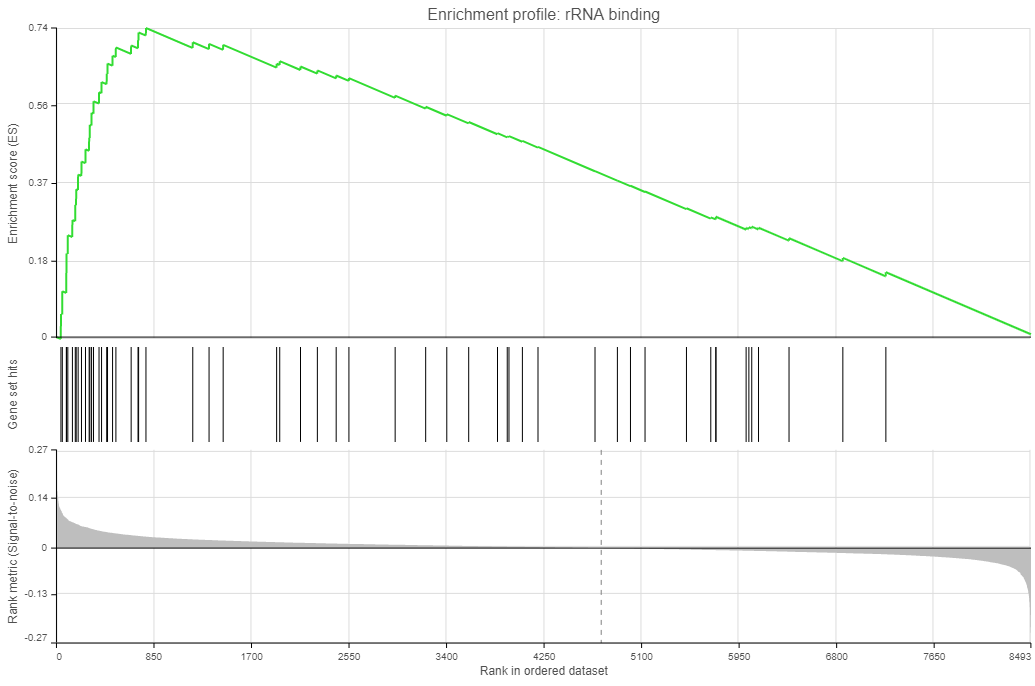
- Enrichment score. The algorithm walks down the ranked list of all the genes in the model, increasing the running sum each time when a gene in the current gene set is encountered. Conversely, the running-sum is decreased each time a gene not in the current gene set is encountered. The magnitude of the increment depends on the correlation of the gene with the experimental factor. The enrichment score is then the maximum deviation from zero encountered in the random walk (the summit of the curve).
- Gene set hits. Each column shows the location of a gene from the current gene set, within the ranked list of all the genes in the model.
- Rank metric. The plot shows the value of the ranking metric as you move down the ranked list of all the genes in the model. The ranking metric measures a gene’s correlation with a phenotype. A positive value of the metric indicates correlation with the first category (Numerator) and a negative value indicates correlation with the second category (Denominator).
| Numbered figure captions | ||||
|---|---|---|---|---|
| ||||
|
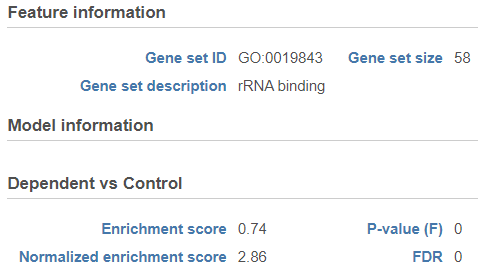
Click on the View extra details plot (![]() ) to open a gene set-specific report page (Figure 12).
) to open a gene set-specific report page (Figure 12).
| Numbered figure captions | ||||
|---|---|---|---|---|
| ||||
|
References
- Subramanian A, Tamayo P, Mootha VK, et al. Gene set enrichment analysis: a knowledge-based approach for interpreting genome-wide expression profiles. Proc Natl Acad Sci U S A. 2005;102(43):15545-15550. doi:10.1073/pnas.0506580102
- Mootha VK, Lindgren CM, Eriksson KF, et al. PGC-1alpha-responsive genes involved in oxidative phosphorylation are coordinately downregulated in human diabetes. Nat Genet. 2003;34(3):267-273. doi:10.1038/ng1180
Overview
Content Tools