Page History
...
| Numbered figure captions | ||||
|---|---|---|---|---|
| ||||
|

The report consists of two parts: the GSEA result table on the right and the filter panel on the left (Figure 9).
| Numbered figure captions | ||||
|---|---|---|---|---|
| ||||
|
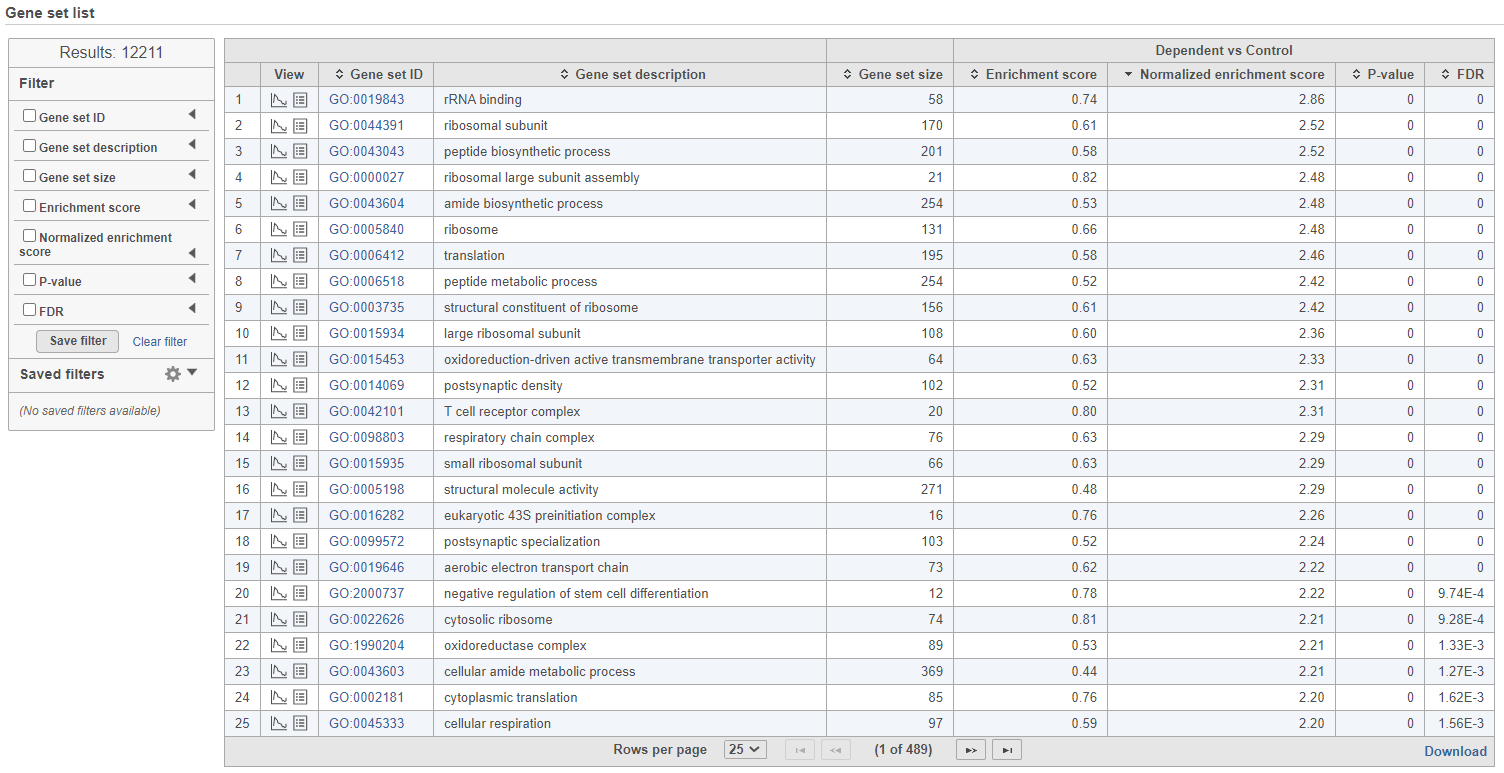
The comparison (Denominator vs. Numerator) is given at the top of the GSEA table. To download the table to your local computer as a text file, use the Download link in the bottom right. Each row of the table corresponds to one gene set and the gene sets are ranked by the P-value, ascending (lowest values at the top). The carrets (![]() ) in the column headers are used for sorting. The columns of the table are as follows.
) in the column headers are used for sorting. The columns of the table are as follows.
- View. The icons in the View column open the enrichment plot (
 ) or the extra details report (
 ) (explanations below).
 - Gene set ID. The Gene set IDs are based on the gene set file that was selected during set up. Each ID is a link to the geneontology.org page of the selected set.
- Gene set size. Number of genes in the set (as specified in the gene set file).
- Enrichment score. The enrichment score reflects the degree to which the current gene set is overrepresented at the top or the bottom of the ranked list of all the genes in the gene model (for details, see the References). The higher the enrichment score the more overrepresented (enriched) the gene set is.
- Normalised score. Normalisation of the enrichment score takes into account the size of the gene set. We recommend to use normalised values for filtering.
- P-value. P-value estimates the statistical significance of the enrichment score.
- FDR. False discovery rate (FDR) is used to control for multiple testing. We recommend to use FDR values for filtering.
References
- Subramanian A, Tamayo P, Mootha VK, et al. Gene set enrichment analysis: a knowledge-based approach for interpreting genome-wide expression profiles. Proc Natl Acad Sci U S A. 2005;102(43):15545-15550. doi:10.1073/pnas.0506580102
- Mootha VK, Lindgren CM, Eriksson KF, et al. PGC-1alpha-responsive genes involved in oxidative phosphorylation are coordinately downregulated in human diabetes. Nat Genet. 2003;34(3):267-273. doi:10.1038/ng1180
Overview
Content Tools