Page History
...
| Numbered figure captions | ||||
|---|---|---|---|---|
| ||||
|
...
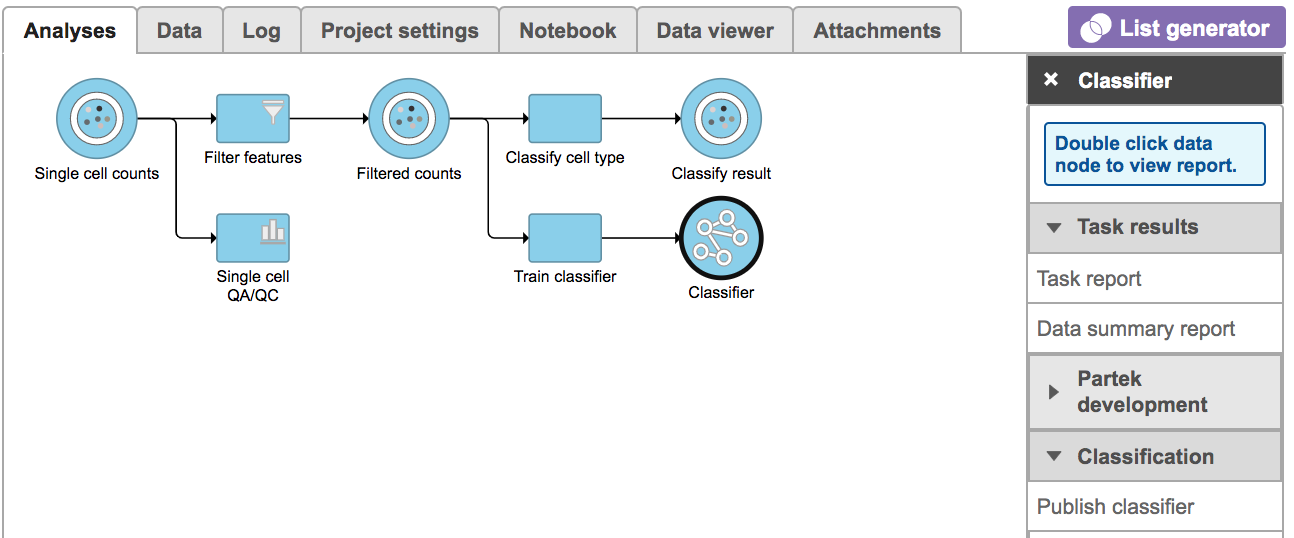
Once the task has been finished, click the Classifier datanode and find the Task report in the Task results section, or prompt it to be one of the Managed classifiers by clicking the Publish classifier task in Classification section (Figure 7).
| Numbered figure captions | ||||
|---|---|---|---|---|
| ||||
|
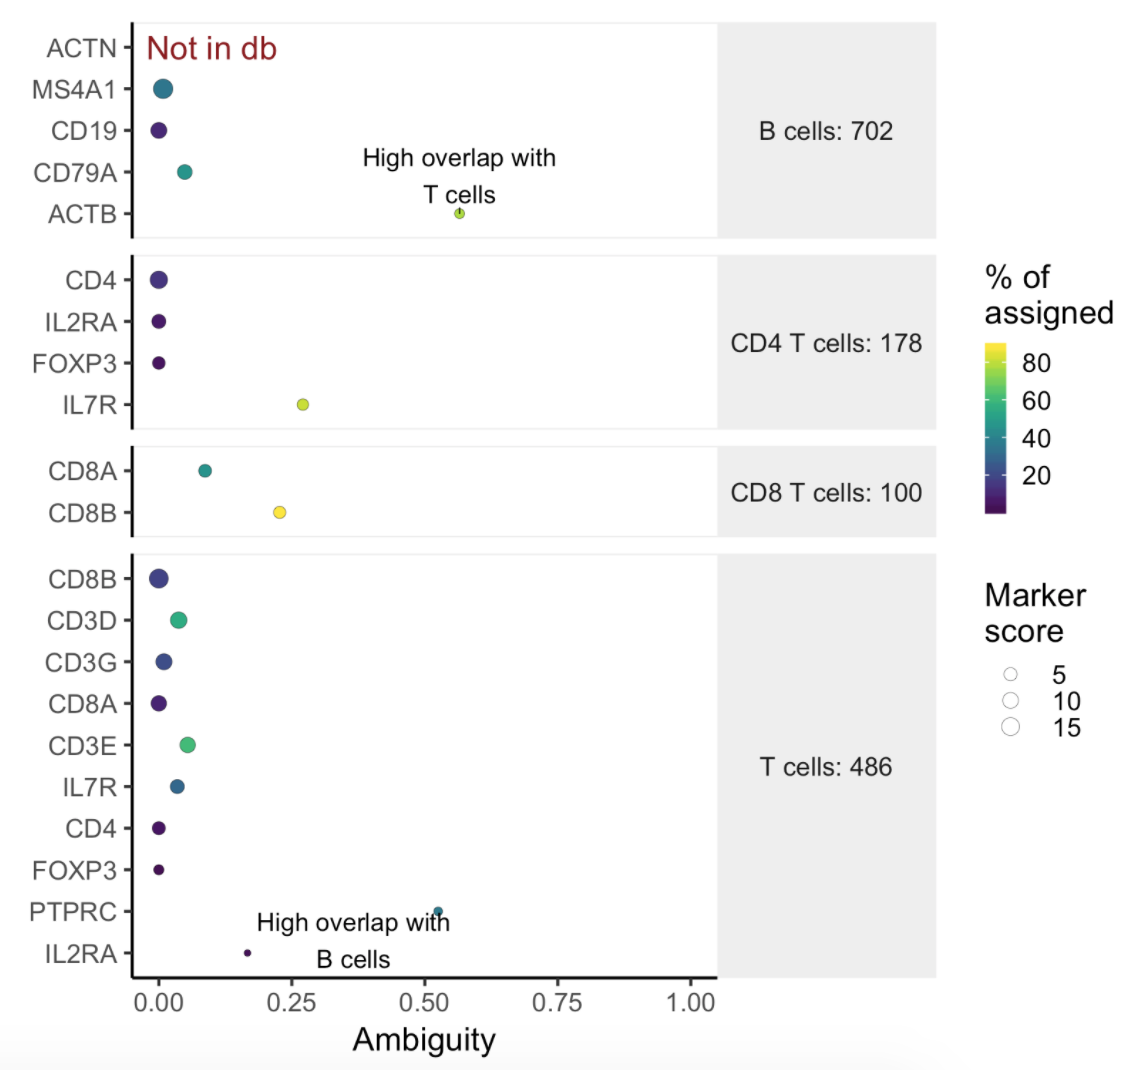
Users will find two parts in the task report: marker evaluation plot (Figure 8) and the classification gene table (Figure 9). The marker evaluation plot provides some key information about whether the chosen markers are good. Ambiguity scores are calculated for each of the markers which indicates how many cells receive ambiguous labels when this marker is included.The classification gene table could give a hint to which genes are chosen as the relevant genes for distinguishing between different cell types.
| Numbered figure captions | ||||
|---|---|---|---|---|
| ||||
|
| Numbered figure captions | ||||
|---|---|---|---|---|
| ||||
|

Other parameters in this task that you can adjust include:
...
Overview
Content Tools