Page History
...
| Numbered figure captions | ||||
|---|---|---|---|---|
| ||||
|
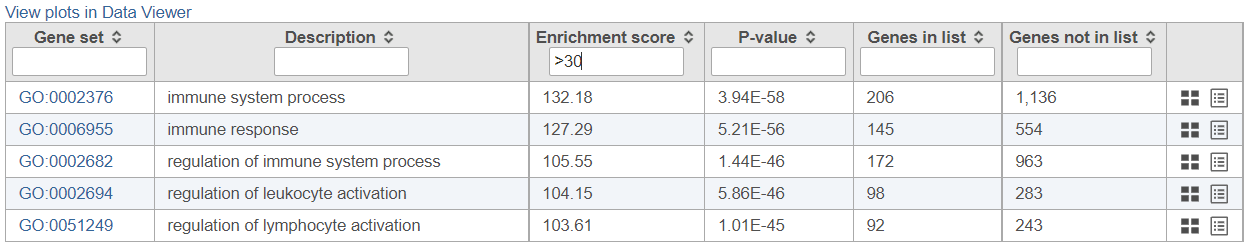
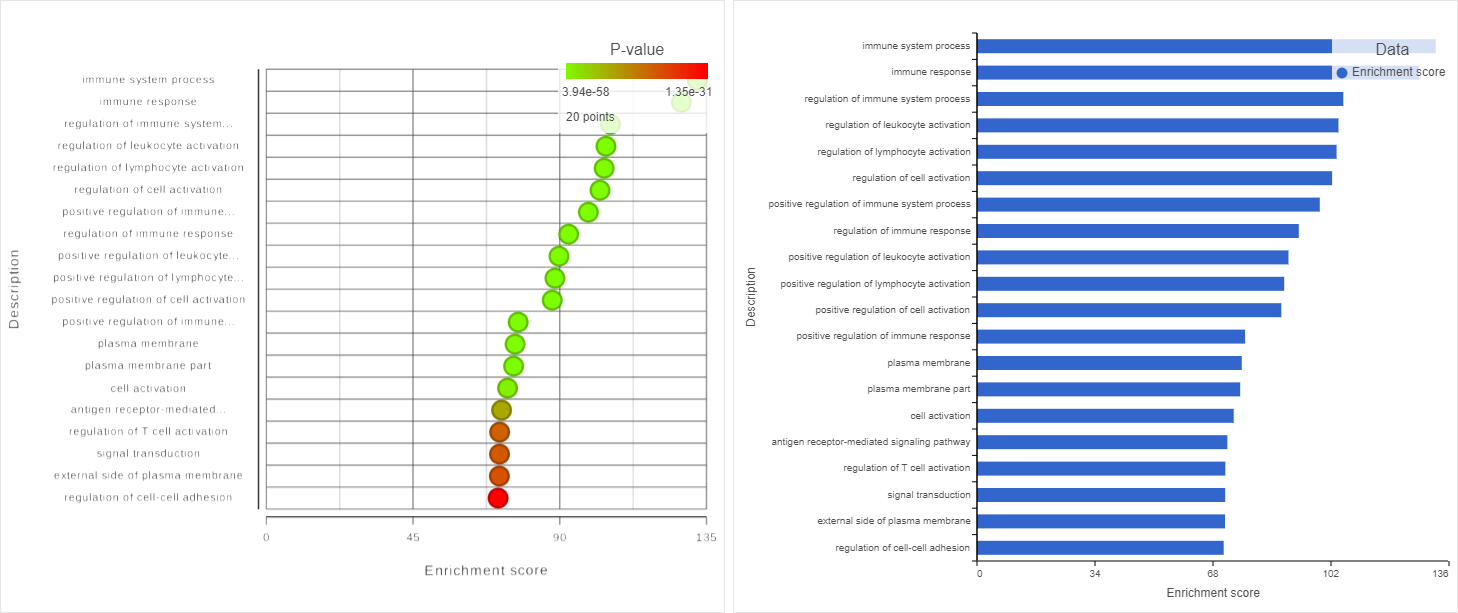
Two plots are loaded into Data Viewer (Figure 9). Both plots show enrichment score on the horizontal axis and gene ontology categories (i.e. the ones present in the gene enrichment table) on the vertical axis. Both plots show enrichments scores (Enrichment score column of the gene ontology table) and - in addition - the plot on the left uses color range to depict enrichment P-value (green = low, red = high P-value).
The same functionality is available for pathway enrichment results.
| Numbered figure captions | ||||
|---|---|---|---|---|
| ||||
|
References
- Ashburner M, Ball CA, Blake JA et al. Gene Ontology: tool for the unification of biology. Nat Genetics. 2000; 25:25-29.
- The Gene Ontology Consortium. Gene Ontology Consortium: going forward. Nucleic Acids Res. 2015; 43:D1049-1056.Recommended citations from the Geneontology.org website
...
Overview
Content Tools