Page History
Partek® Flow® Partek Flow plots genomic information on the canvas and is organized into horizontal sections called tracks. The exact number, type, and presentation of tracks depend on several factors, such as the underlying pipeline, available annotation, and the level of zoom. The tracks are added, removed, or customized via the Select tracks dialog (Figure 1).
| Numbered figure captions | ||||
|---|---|---|---|---|
| ||||
|
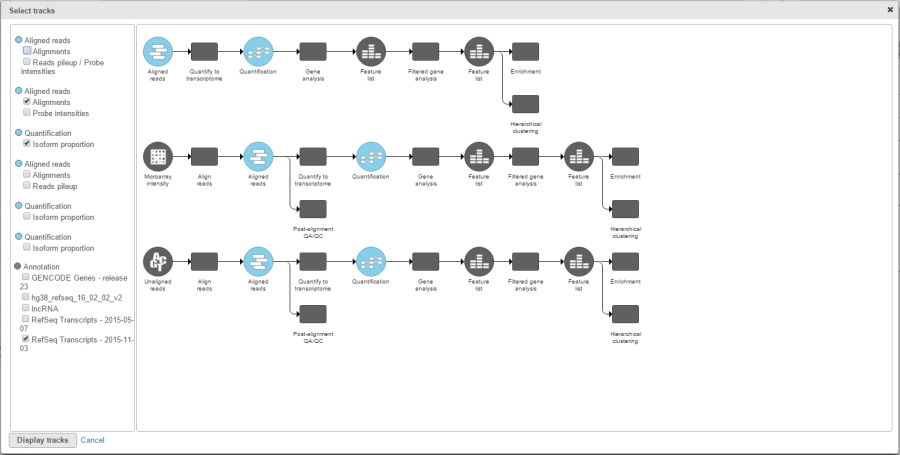
The content of the Select tracks dialog depends on the data nodes present on the Analysis tab of the current project (an example is shown in Figure 2). Current pipeline is depicted in the center of the window, while data nodes that can be visualised are highlighted by the colour of their layer. Tracks can be turned on or off by selecting the check boxes in the list of possible tracks (and data nodes) on the right. To uncheck all, use the Clear selection button.
| Numbered figure captions | ||||
|---|---|---|---|---|
| ||||
|
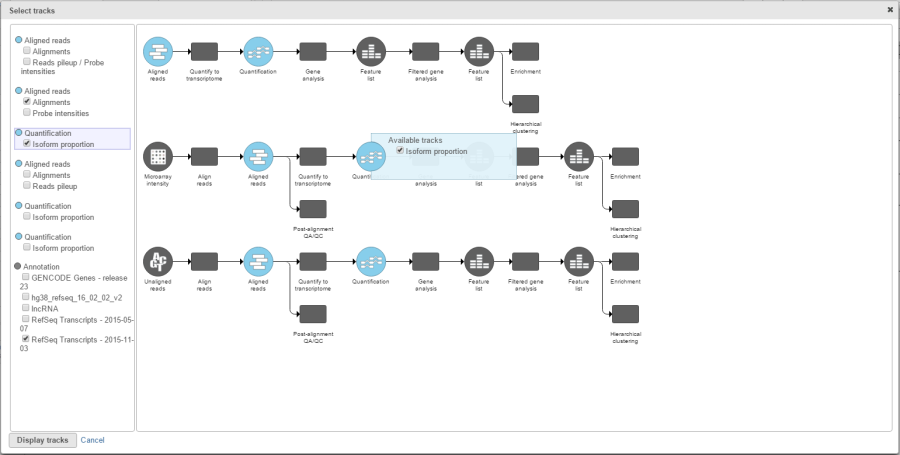
For the ease of use, the pipeline and the list of tracks are linked: hovering over the track list highlights the matching data node in the pipeline and vice versa, i.e. selecting a data node in the pipeline panel highlights the respective node in the track list (Figure 3). Once you decided on the tracks that should be plotted, push Display tracks to depict them on the canvas.
| Numbered figure captions | ||||
|---|---|---|---|---|
| ||||
|
| Additional assistance |
|---|
| Page Turner | ||
|---|---|---|
|
...
Overview
Content Tools