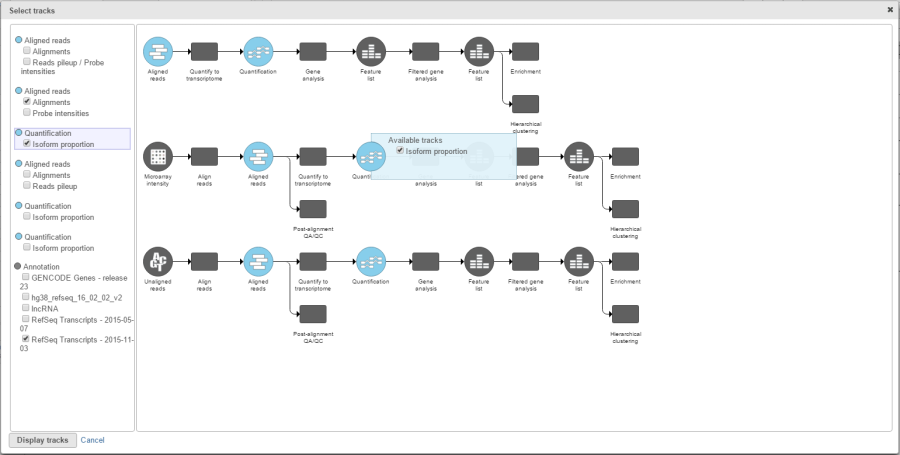
Selecting data tracks for the visualisation using the Select tracks dialog (an example). Hovering over the track list highlights the matching data node in the pipeline and vice versa, i.e. selecting a data node in the pipeline panel (e.g. Isoform proportion track) highlights the respective node in the track list (Normalised counts and Isoform proportion)