...
| Numbered figure captions |
|---|
| SubtitleText | Specifying attribute levels for sub-group comparisons (contrast): Select A for Cell type on the top, B for Cell type on the bottom, and click Add comparison to compare A vs B |
|---|
| AnchorName | Subgroup attribute selection |
|---|
|
 Image Modified Image Modified
|
To compare Time point 5 vs. 0, select 5 for Time on the top, 0 for Time on the bottom, and click Add comparison (Figure 3).
...
| Numbered figure captions |
|---|
| SubtitleText | Specifying attribute levels for sub-group comparisons (contrast): Select 5 for Time on the top, 0 for Time on the bottom, click Add comparison to compare 5 vs 0 |
|---|
| AnchorName | Subgroup Attribute comparison |
|---|
|
Image Modified |
To compare cell types at a certain time point, e.g. time point 5, select A and 5 on the top, and B and 5 on the bottom. Thereafter click Add comparison (Figure 4).
...
| Numbered figure captions |
|---|
| SubtitleText | Specifying attribute levels for subgroup comparisons (contrast): Select A and 5 on the top, B and 5 on the bottom, click Add comparison to compare A*5 vs B*5 |
|---|
| AnchorName | Subgroup attribute comparrison contrast |
|---|
|
Image Modified |
Multiple comparisons can be computed in one GSA run; Figure 5 shows the above three comparisons are added in the computation.
...
| Numbered figure captions |
|---|
| SubtitleText | Configuring advanced GSA options |
|---|
| AnchorName | GSA advanced options |
|---|
|
Image Modified |
Low-expression feature
...
| Numbered figure captions |
|---|
| SubtitleText | Configuring advanced options when running ANOVA |
|---|
| AnchorName | Advanced ANOVA options |
|---|
|
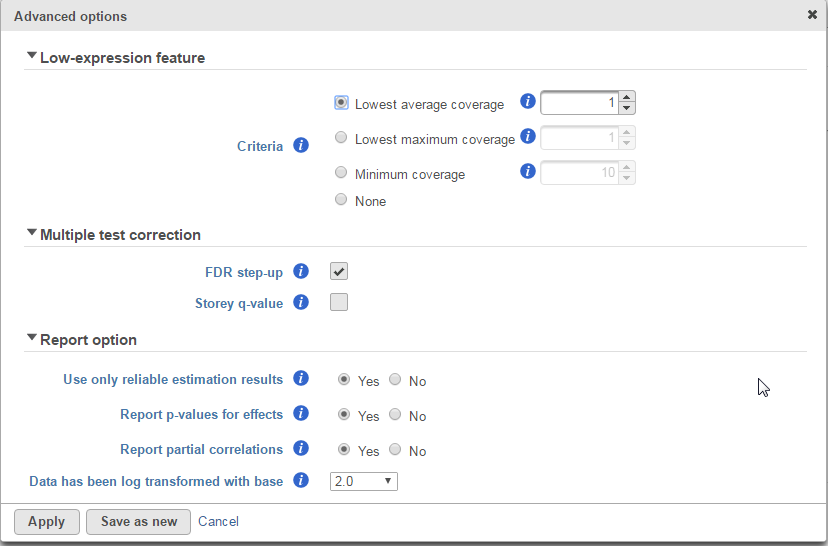 Image Modified Image Modified
|
Low-expression feature and Multiple test correction sections are the same as the matching GSA advanced option, see above GSA advanced options
...