Page History
...
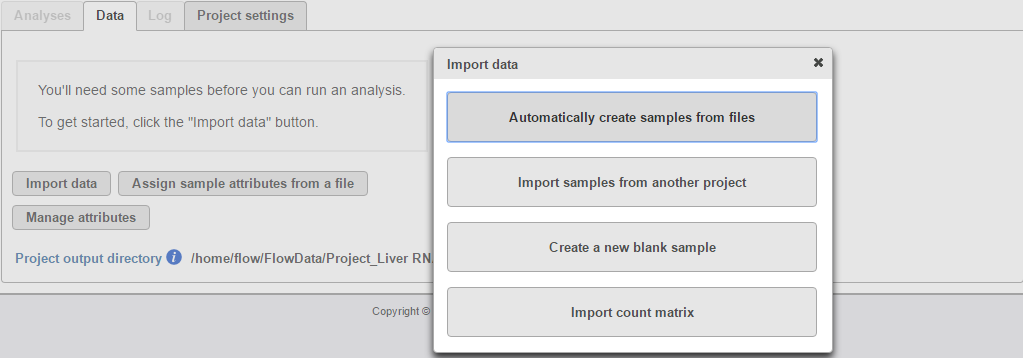
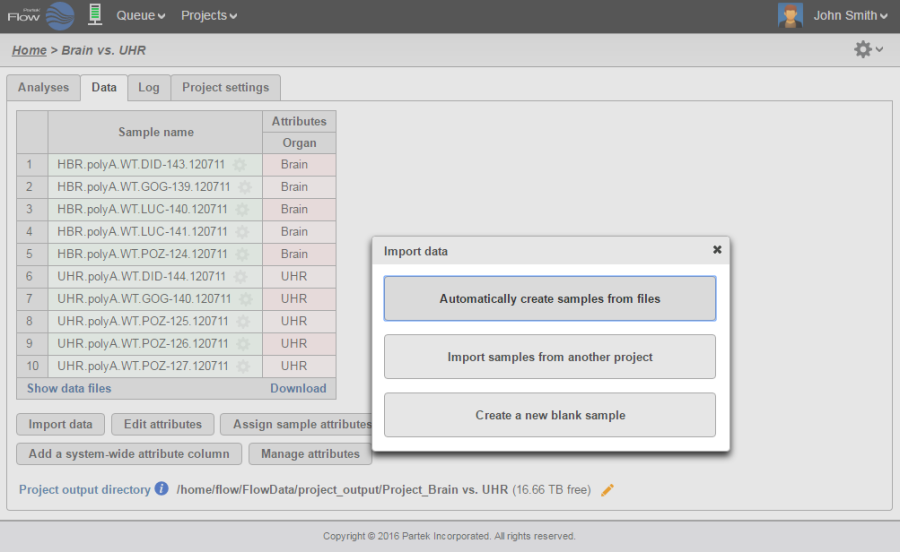
For a new project, where no samples have yet been added, the Data tab will automatically prompt you to add samples (Figure 1). To add samples to the project, click Import data. Four options will be displayed.
| Numbered figure captions | ||||
|---|---|---|---|---|
| ||||
|
...
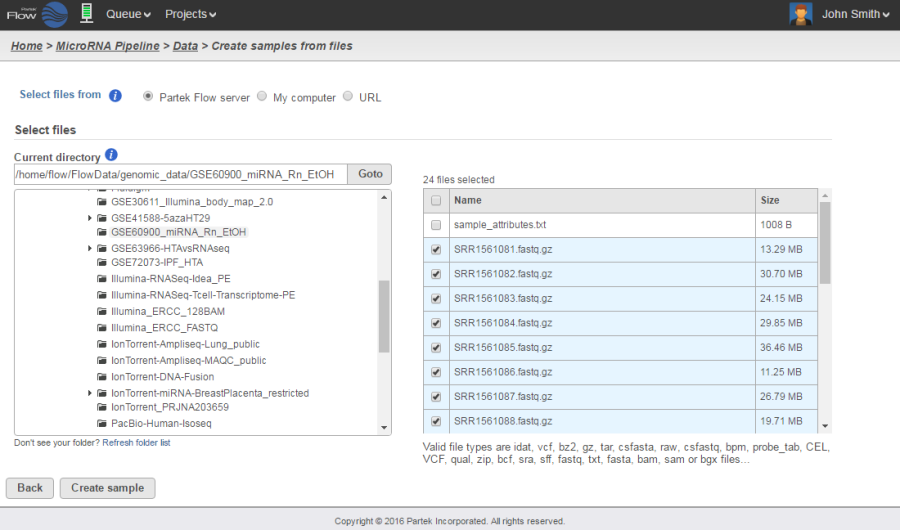
Select the Automatically create samples from files button. The next screen will feature a file browser that will show any folders you have access to in the Partek Flow server (Figure 2). Select a folder by clicking the folder name. Files in the selected folder that have file formats that can be imported by Partek Flow will be displayed and tick-marked on the right panel. You can exclude some files from the folder by unselecting the check mark on the left side of the filename. When you have made your selections, click the Create sample button.
| Numbered figure captions | ||||
|---|---|---|---|---|
| ||||
|
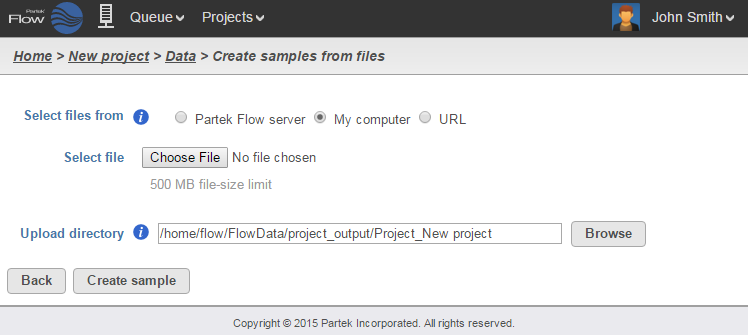
Alternatively, files can also be uploaded and imported into the project from the user's local computer. Select the My computer radio button (Figure 3) and the options of selecting the local file and the upload (destination) directory will appear. Only one file at a time can be imported to a project using this method.
| Numbered figure captions | ||||
|---|---|---|---|---|
| ||||
|
...
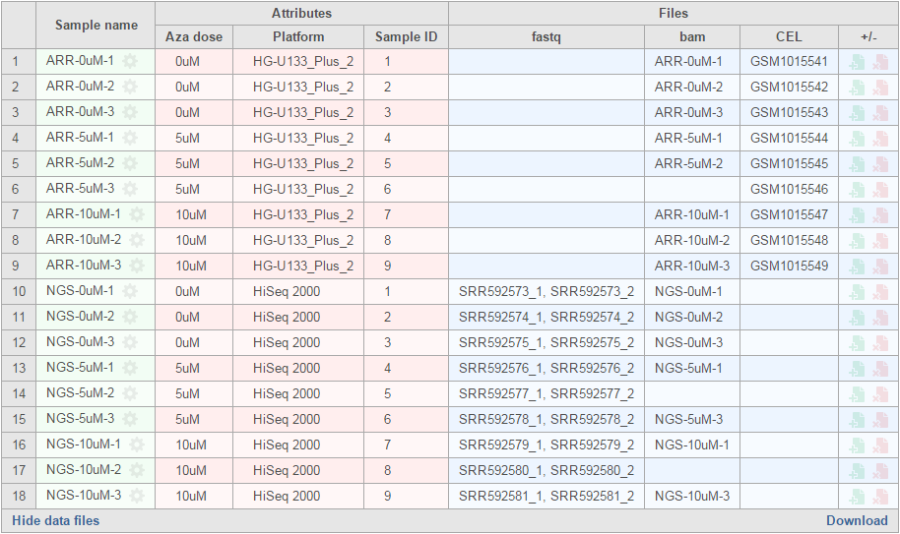
The columns in the expanded view show the files associated with each sample. Files are organized by file type. Any filename extensions that indicate compression (such as .gz) are not shown.
| Numbered figure captions | ||||
|---|---|---|---|---|
| ||||
|
...
Mouse over the +/- column and click the green icon ( ![]() ) to associate a file(s) to the sample. Perform the process for every sample in your project.
) to associate a file(s) to the sample. Perform the process for every sample in your project.
| Numbered figure captions | ||||
|---|---|---|---|---|
| ||||
|
...
Additional samples can be added to any existing project simply by opening the project, going to the Data tab, and clicking the Import data button (Figure 7). Three options to add samples will be revealed.
| Numbered figure captions | ||||
|---|---|---|---|---|
| ||||
|
...
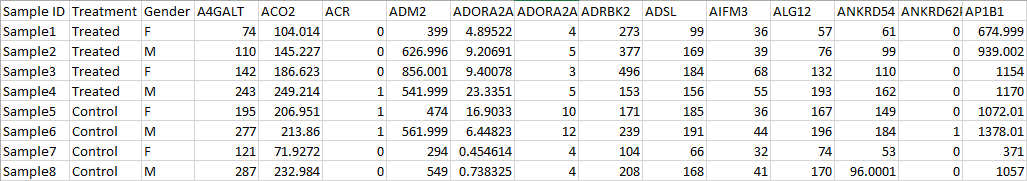
- The file contains numeric values in a tab-delimited format, samples can be on rows while features (e.g.gene names) are in columns, or vice versa
- The file contains unique sample IDs and feature IDs
- If the data contains sample attribute information, all these attributes have to be ether
- The leftmost columns when samples are on rows (Figure 8)
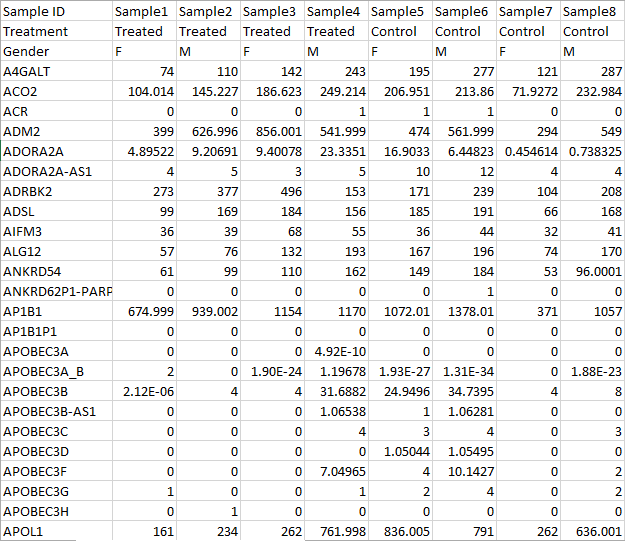
- The first few rows when samples are on columns (Figure 9)
| Numbered figure captions | ||||
|---|---|---|---|---|
| ||||
 |
...
...
| Numbered figure captions | ||||
|---|---|---|---|---|
| ||||
 |
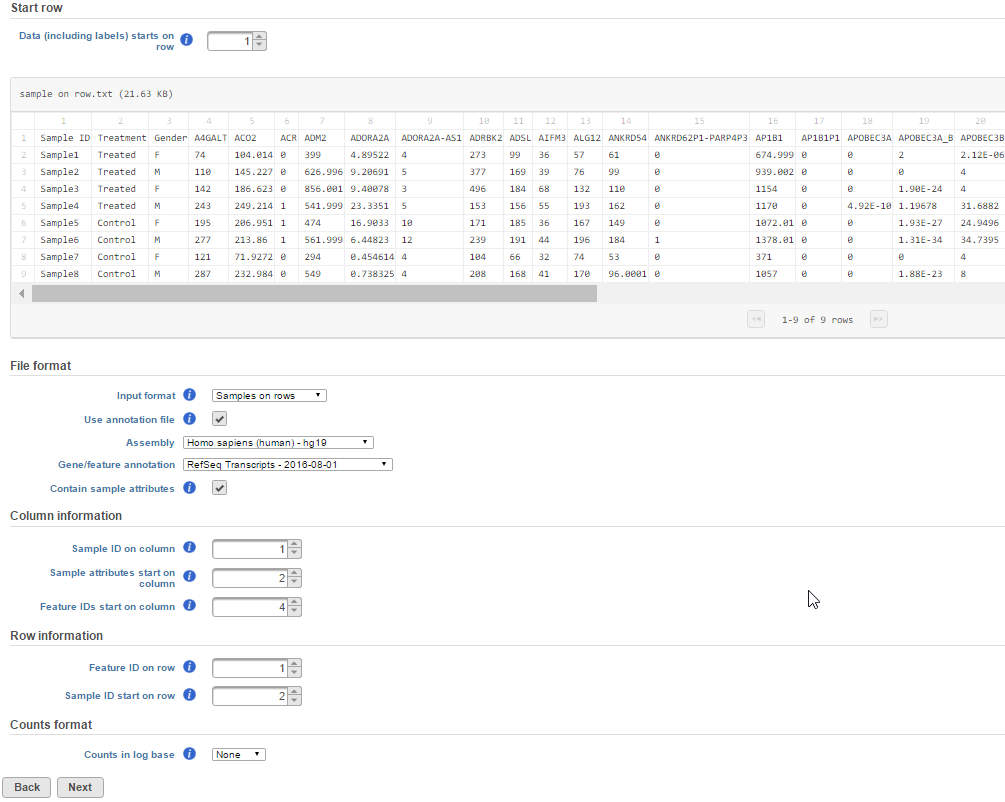
Like all other input files, you can upload the file from the Partek Flow server, My Computer or via a URL. Uploading the file brings up a file preview window (Figure 10). The preview of the first few rows and columns of the text file should help you determine on which rows/columns the relevant counts are located (the preview will display up to 100 rows and 100 columns). Inspect the text preview and indicate the orientation of the text file under File format>Input format.
...
If the read counts are based on a compatible annotation file in Partek Flow, you can specify that annotation file under Gene/feature annotation. Select the appropriate genome build and annotation model for your count data. Select the Contain sample attributes checkbox if your data includes additional sample information.
| Numbered figure captions | ||||
|---|---|---|---|---|
| ||||
|
...
If the data has been log transformed, specify the base under Counts format.
Project output directory
The project output directory is the folder within the Partek Flow server where all output files produced during analysis will be stored.
...
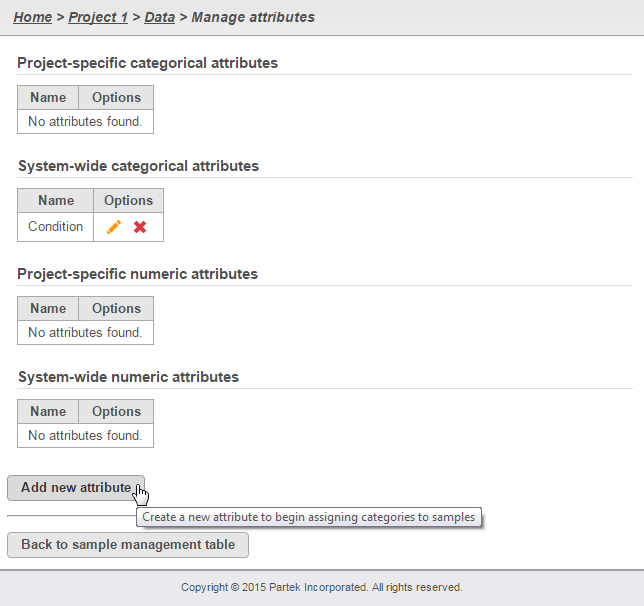
Attributes can be managed or created within a project. Under the Data tab, click the button to open the Manage attributes page (Figure 10).
| Numbered figure captions | ||||
|---|---|---|---|---|
| ||||
|
To prepare for later data analysis using statistical tools, attributes can either be categorical or numeric (i.e., continuous).
...
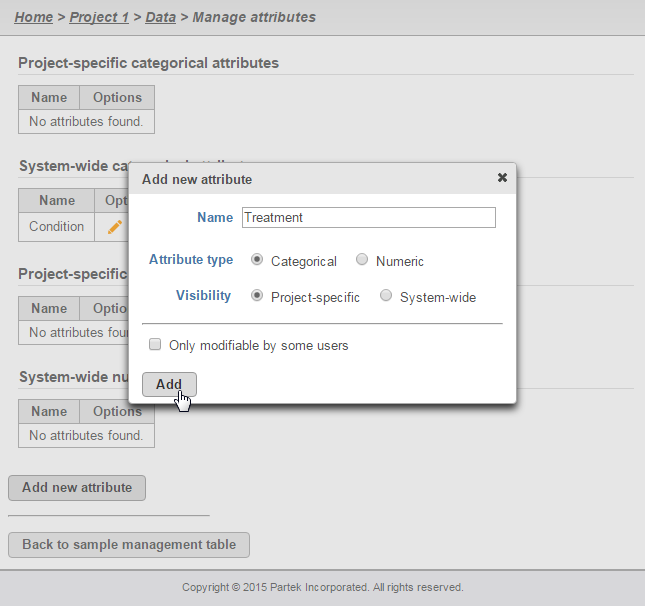
To add a categorical attribute in the Manage attributes page, click the Add new attribute (Figure 11). In the dialog box, type a Name for the attribute, select the Categorical radio button next to Attribute type, select the visibility of the attribute and then click the Add button.
| Numbered figure captions | ||||
|---|---|---|---|---|
| ||||
|
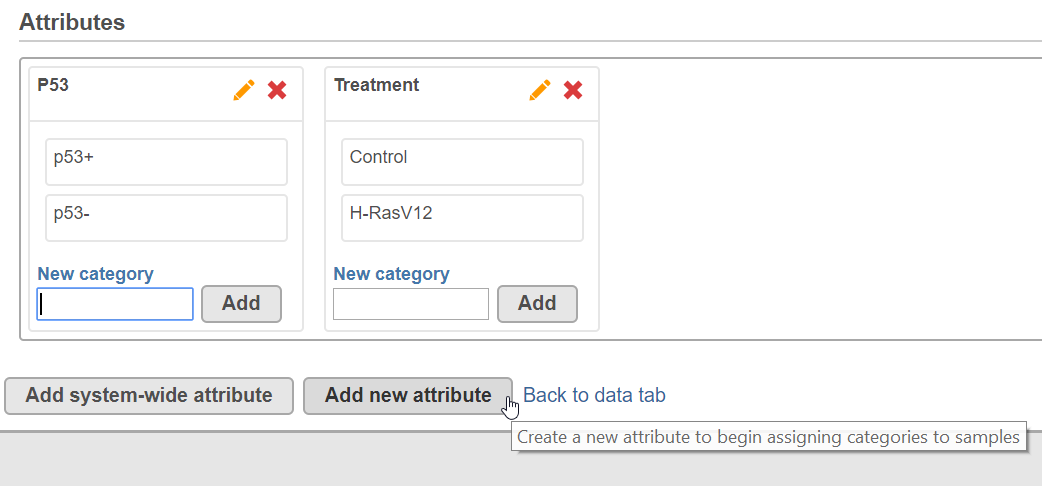
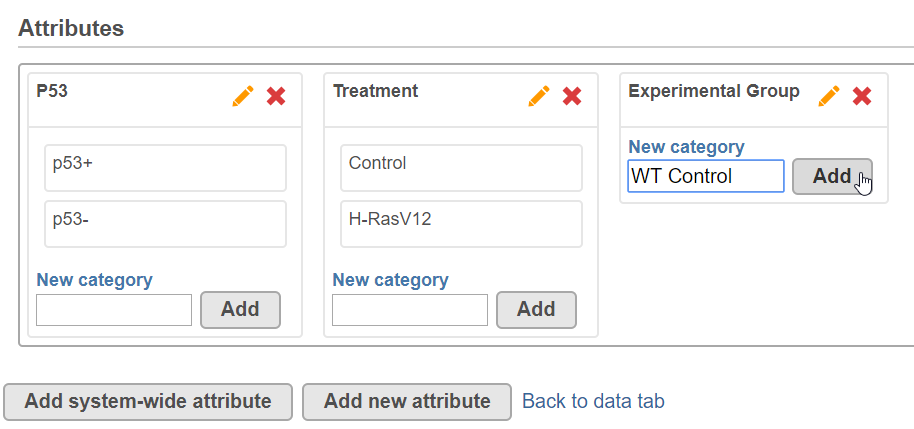
Individual categories for the attribute must then be entered. Enter a name of the New category and click Add in the New category text box and click Add (Figure 12). The Name of the new category will show up in the table. The category can also be edited by clicking ![]() or deleted by clicking
or deleted by clicking . Additionally, sub-categories can be added by clicking
![]() in the Options column. After all the categories have been added to this attribute, click Close to proceed.(visible on mouse-over). Repeat to add additional categories within the attribute.
in the Options column. After all the categories have been added to this attribute, click Close to proceed.(visible on mouse-over). Repeat to add additional categories within the attribute.
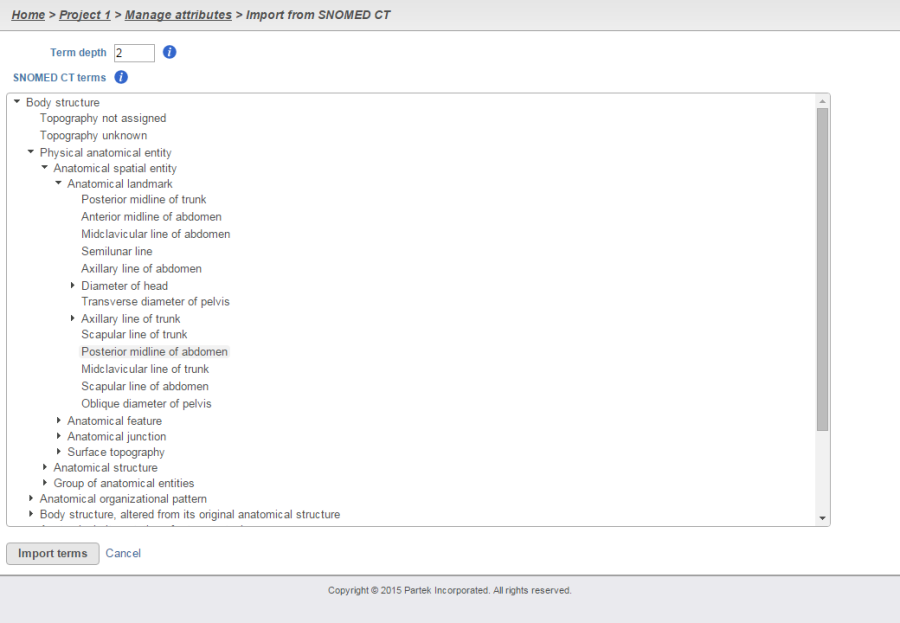
Repeat the process for additional attributes of the samples in your study. When done, click Back to sample management table. Categorical attributes will default to Project-specific visibility. An additional feature to facilitate the controlled vocabulary in Partek Flow is the integration of terms used by SNOMED CT, a healthcare terminology used for electronic health records. They can be added easily by managing the categories of an attribute and selecting Import terms from SNOMED CT shown in Figure 12. Available terms include those for body structure, specimen, clinical findings, or organism. Select multiple terms from SNOMED CT by holding Ctrl key on the keyboard while clicking the mouse to select. These terms will become new top level categories in your attribute. When terms are imported from SNOMED CT, the Term depth indicates the number of sublevels that will also be imported as subcategories in your attribute.
| Numbered figure captions | ||||||
|---|---|---|---|---|---|---|
|
| |||||
|
Adding a numeric attribute
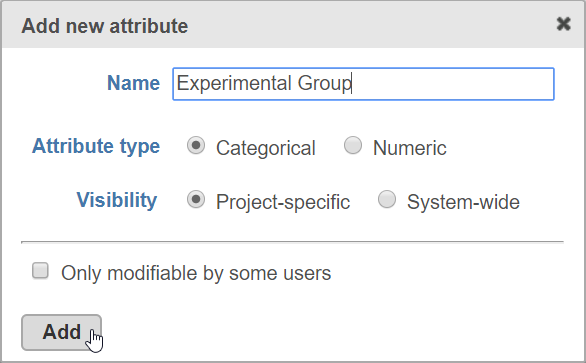
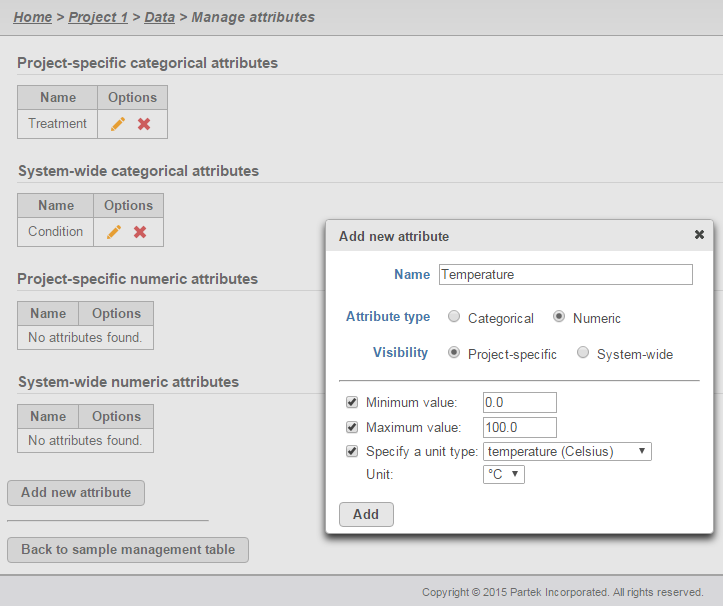
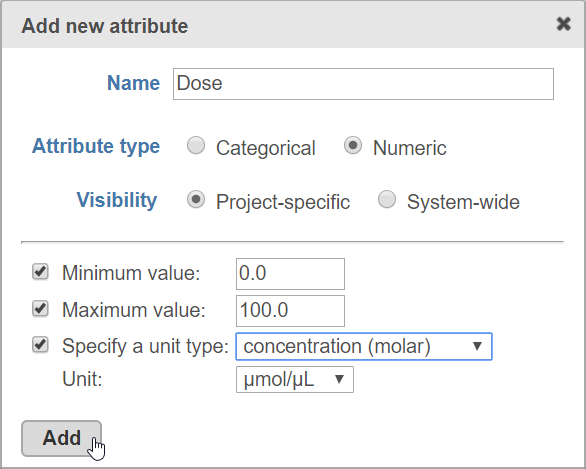
To add a numeric attribute in the Manage attributes page, click the Add new attribute. In the dialog box (Figure 13), type a Name for the attribute, select the Numeric radio button next to Attribute type, and then click the Add button. Some optional parameters for numeric attributes include the Minimum value, Maximum value, and Units. When done, click Add to return to the Manage attributes page. Repeat the process add more numeric attributes. When done, click Back to sample management table.
| Numbered figure captions | ||||
|---|---|---|---|---|
| ||||
|
Adding a system-wide attribute
...
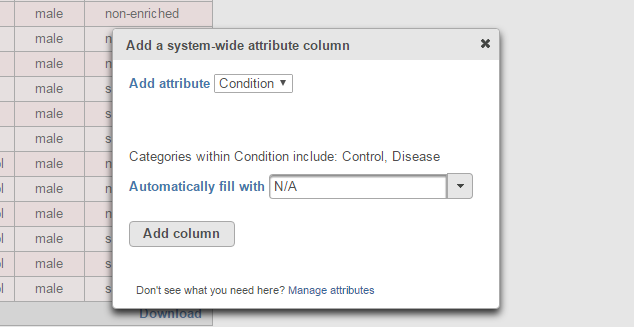
For an System-wide categorical attribute, the different categories are listed and you have the option of pre-filling the columns with N/A (or any other category within the attribute). Click Add column and you will return to the Data Tab.
| Numbered figure captions | ||||
|---|---|---|---|---|
| ||||
|
Assigning categories or values to attributes
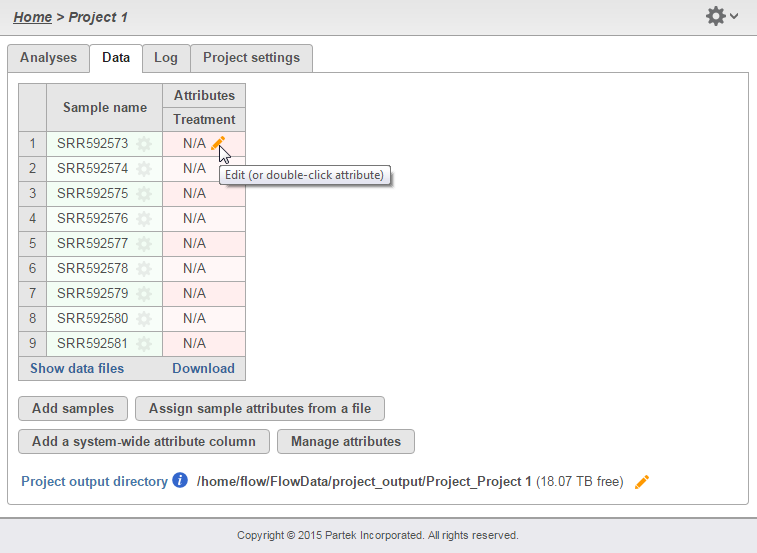
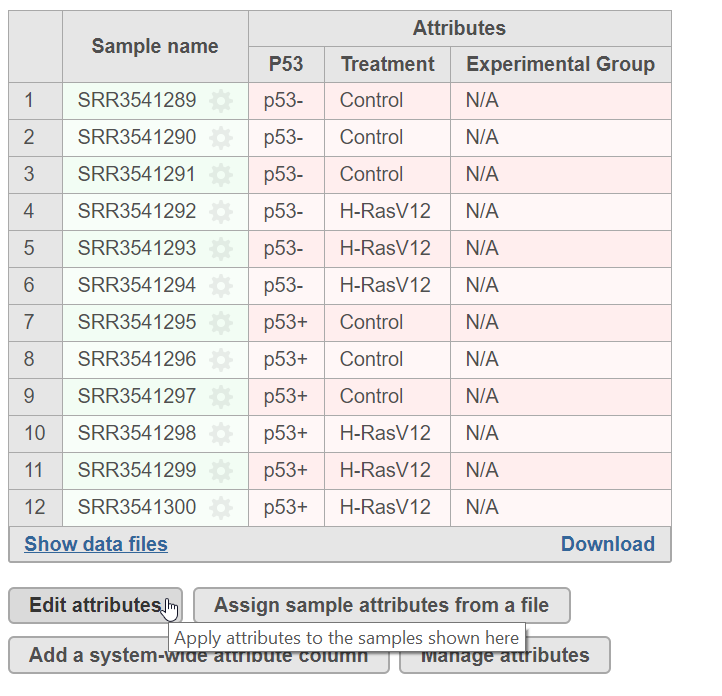
After adding all the desired attributes to a project, the sample management table will show a new column for each attribute (Figure 15). The columns will initially as "N/A", as the samples have not yet been categorized or assigned a value. To edit the table, click ![]() Edit attributes. Assign the sample attributes by using a drop down for categorical attributes (controlled vocabulary) or typing with a keyboard for numeric attributes.
Edit attributes. Assign the sample attributes by using a drop down for categorical attributes (controlled vocabulary) or typing with a keyboard for numeric attributes.
| Numbered figure captions | ||||
|---|---|---|---|---|
| ||||
|
When all the attributes have been entered, click Apply changes and the sample management table will be updated. After editing the sample table, make sure there are no fields with blank or N/A values before proceeding. To rename or delete attributes, click Manage attributes from the Data tab to access the Manage attributes page. Note that you cannot delete an attribute if a sample is assigned to it.
Assigning attributes using a Sample Annotation Text File
...
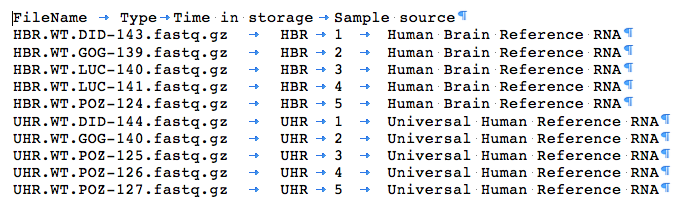
Using a text editor, prepare a table containing the attributes. An example is shown in Figure 16. There should only be one tab between columns with no extra tabs after the last column. In this particular example, the first column contains the filename and the text file is saved as Sampleinfo.txt.
| Numbered figure captions | ||||
|---|---|---|---|---|
| ||||
|
...
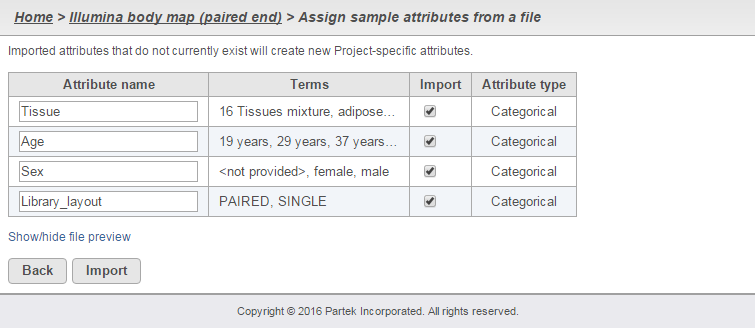
Select the attributes you want to import by clicking the Import check box. Imported attributes that do not currently exist in the project will create new project-specific attributes.
| Numbered figure captions | ||||
|---|---|---|---|---|
| ||||
|
...
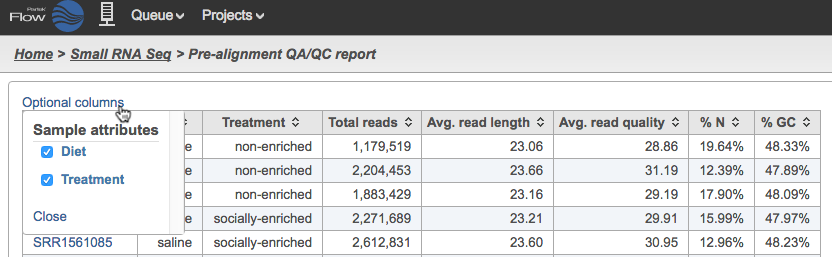
The attributes assigned to the samples within the Data Tab will be associated with the samples throughout the project. During the course of analysis, Partek Flow tasks generate various tables and any attributes associated with a sample can be included in the table as optional columns. An example is shown in Figure 18 for a pre-alignment QA/QC report where the Optional columns link on the top left of the table reveal the different sample attributes.
| Numbered figure captions | ||||
|---|---|---|---|---|
| ||||
|
Deleting or Renaming samples within a Project
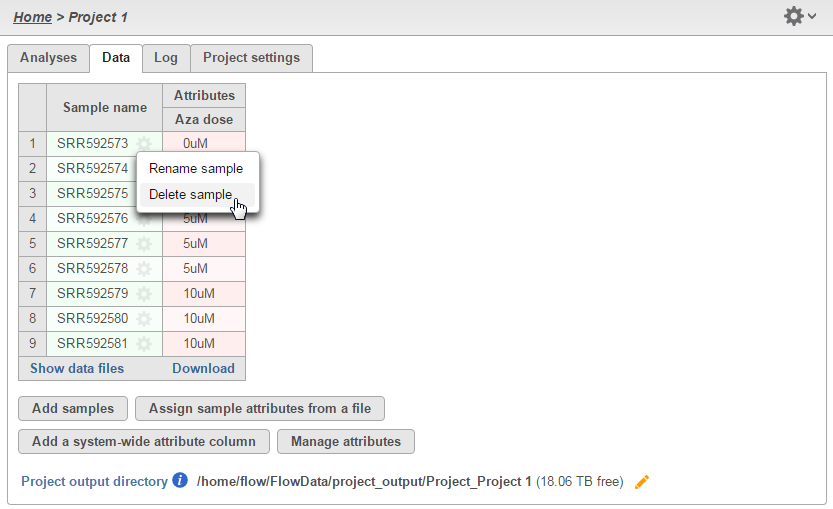
In the Data tab, each sample can be renamed or deleted from the project by clicking the gear icon next to the sample name. The gear icon is readily visible upon mouse over (Figure 19). Sample can only be deleted if no analysis has been performed on the data yet. If any analysis has been performed on the data node, then delete sample operation is invisible. You can perform filter samples in downstream analysis if you want to exclude certain samples in further analysis. Deleting a sample from a project does not delete the associated files, which will remain on the disk.
| Numbered figure captions | ||||
|---|---|---|---|---|
| ||||
|
You can download your completed Sample management table by clicking the Download link at the lower corner of the table. This will export a tab-delimited text file with contents of the table.
| Additional assistance |
|---|
| Page Turner | ||||||
|---|---|---|---|---|---|---|
|
...
Overview
Content Tools