Page History
...
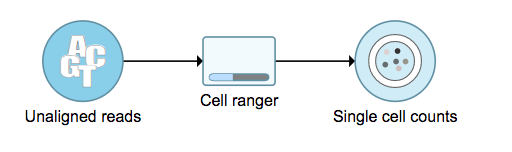
A new data node named ‘Single cell counts’ will be displayed in Flow if the task is running (Figure 6). To open the task report, simply double click the output data node, or select the ‘Task report’ in the section after clicking the data node after the tasking running is finished. User then will find the task report (Figure 7) is the same to the ‘Summary HTML’ from Cell Ranger output.
| Numbered figure captions | ||||
|---|---|---|---|---|
| ||||
|
References
https://support.10xgenomics.com/single-cell-gene-expression/software/overview/welcome
https://support.10xgenomics.com/single-cell-gene-expression/software/pipelines/6.0/release-notes
- https://support.10xgenomics.com/single-cell-gene-expression/software/pipelines/4.0/release-notes
...
Overview
Content Tools