Page History
| Table of Contents | ||
|---|---|---|
|
What is Cell Ranger?
Cell Ranger is a set of analysis pipelines that process Chromium single - cell RNA-seq output data to align reads, generate feature-barcode matrices and perform clustering and gene expression analysis for 10X Genomics Chromium Technology[1].
Cell
...
Ranger - Gene Expression in Partek Flow
The 'cellranger count' pipeline from Cell Ranger v6.0.0[2] has been wrapped in Partek® Flow® as Cell rangerRanger - Gene Expression task. It does not comprehensively cover all of the options and analysis cases Cell Ranger can handle for now, but converts FASTQ files from 'cellranger mkfastq' and performs alignment, filtering, barcode counting, UMI counting for single cell gene expression and Feature Barcode data. The output gene expression count matrix in .h5 format (both raw and filtered available for users to download in the output page of task details) then becomes the starting point for downstream analysis for scRNA-seq in Flow. For Feature Barcode data, Flow outputs a unified feature-barcode matrix that contains gene expression counts alongside Feature Barcode counts for each cell barcode.
Note: when When use Cell ranger Ranger - Gene Expression task in Partek Flow, there is are more restrictions on sampe sample name -- sample name can only contain letters, digits, underscores and dashes. Please Edit edit the sample names on Data tab in Partek Flow to remove any other characters ,e.g. space etc.
Running Cell
...
Ranger - Gene Expression in Flow
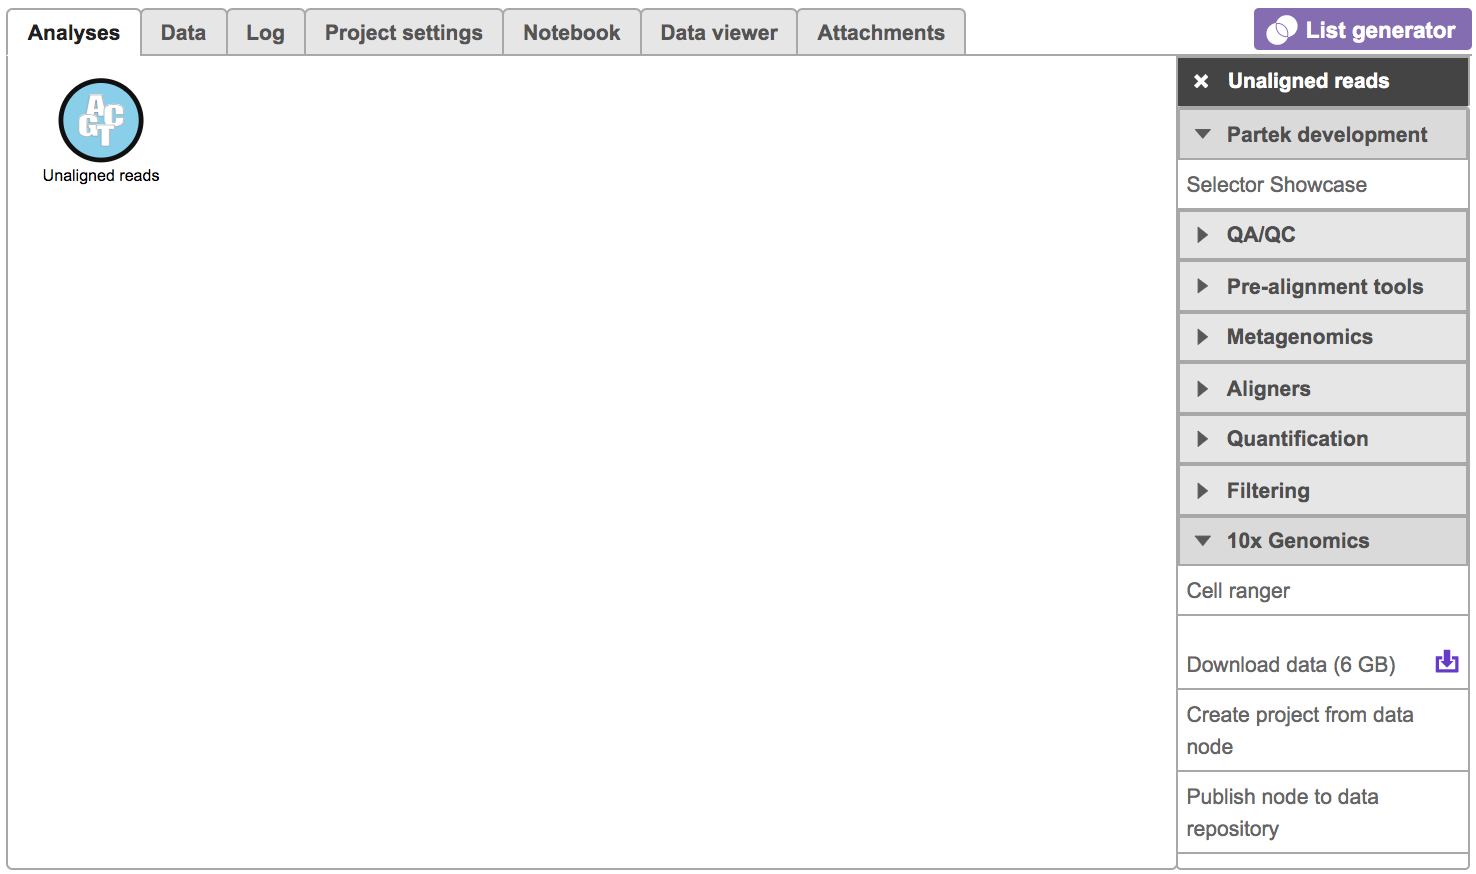
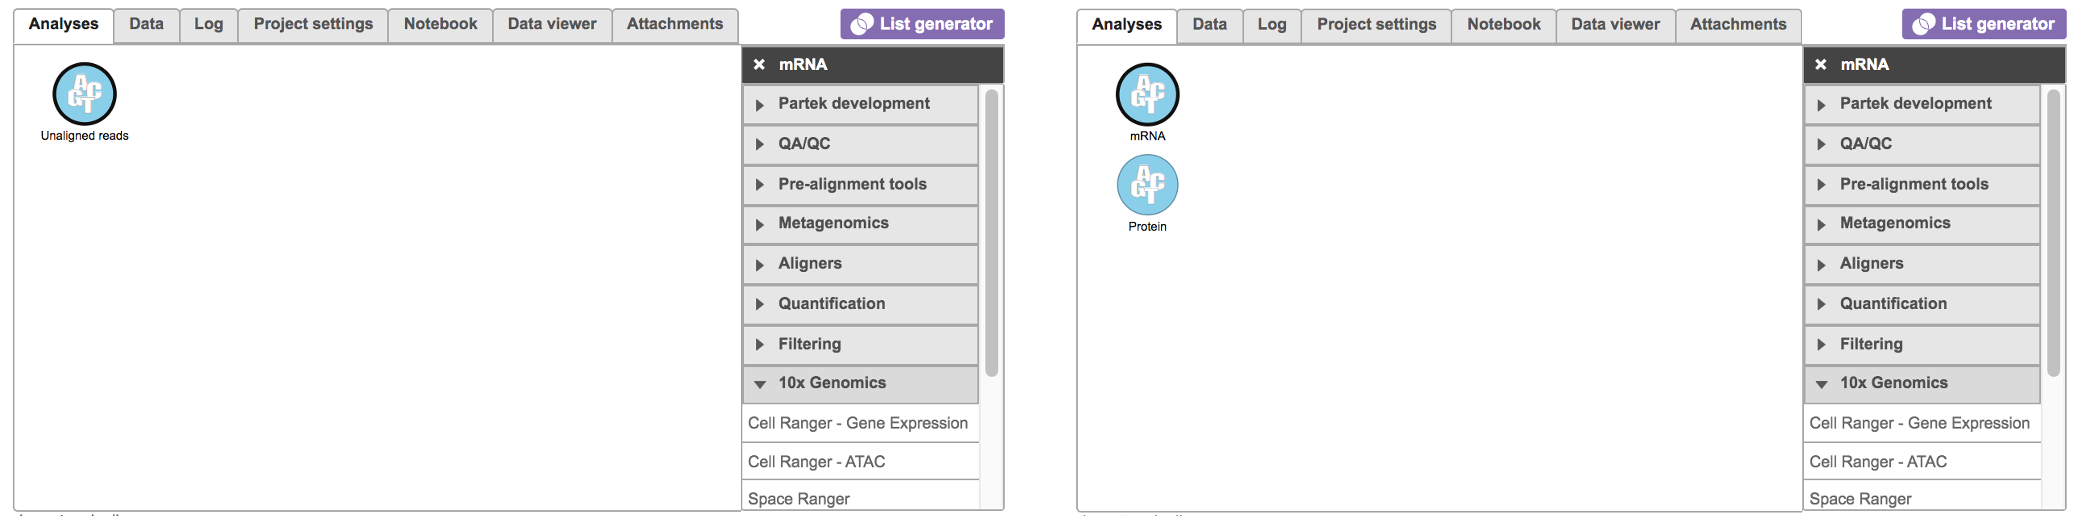
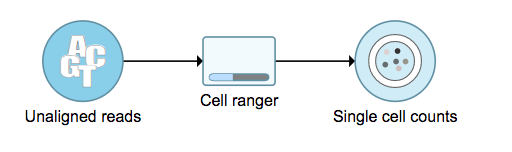
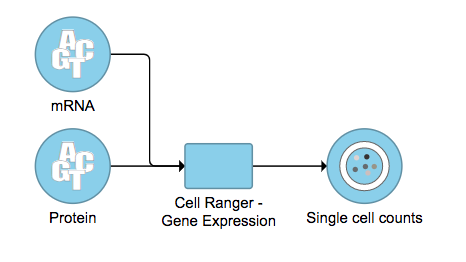
To run the Cell ranger task Ranger - Gene Expression task for scRNA-seq data in Flow, select Unaligned reads datanode, then select Cell rangerRanger - Gene Expression in the 10x Genomics section (left panel, Figure 1). For Feature Barcode data, there will be two data nodes once the FASTQ files have been imported into Flow properly - mRNA and protein (right panel, Figure 1). Users should select mRNA datanode to trigger the Cell ranger - Gene Expression task.
| Numbered figure captions | ||||
|---|---|---|---|---|
| ||||
|
...
|
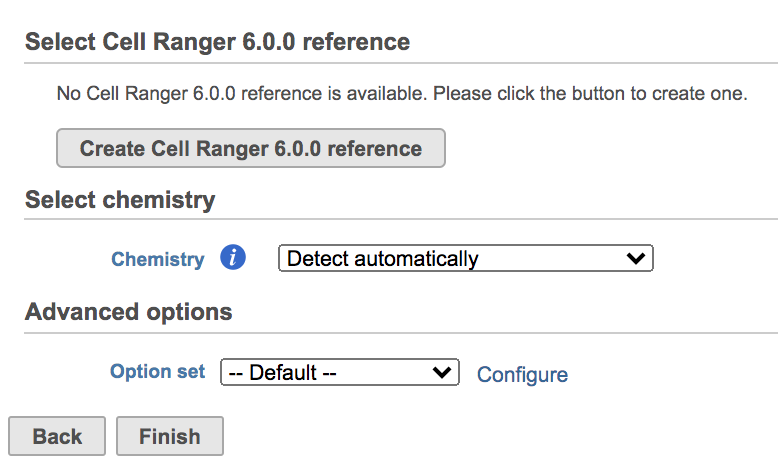
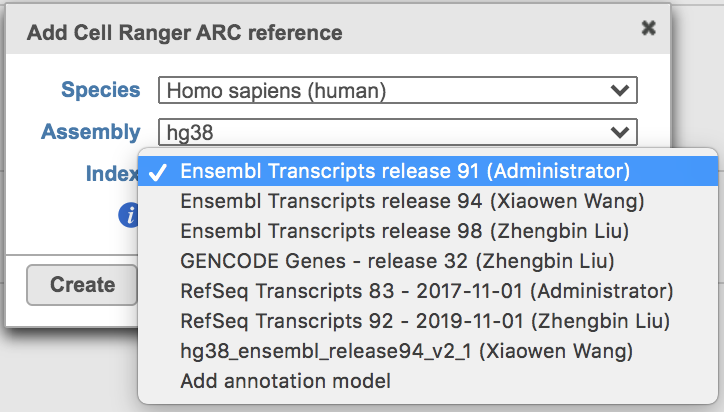
Once the Genomics production has been picked, users will be asked to create a Cell Ranger 6.0.0 reference genome Reference assembly if it is the first time to run the Cell ranger task in Flow Ranger - Gene Expression task (Figure 2). In Partek Flow, we will use Cell Ranger ARC 2.0.0 to create reference assembly for all 10x Genomics analysis pipelines. To create and use a reference assembly, Cell Ranger ARC requires a reference genome sequence (FASTA file) and gene annotations (GTF file), here are the details.
| Numbered figure captions | ||||
|---|---|---|---|---|
| ||||
|
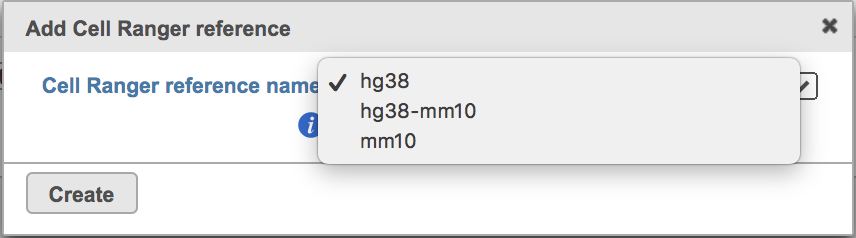
Clicking the big grey button of Create Cell Ranger 6ARC 2.0.0 reference would pop up a new window where lists the three pre-built reference genomes for human(hg38), mouse(mm10) and the mix of two(hg38-mm10), respectively (requirements that users need to fill in (Figure 3). They are exactly To create the same reference genomes (2020-A) that are provided in Cell Ranger by default. In details, the transcriptome annotations are respectively GENCODE v32 for human and vM23 for mouse, which are equivalent to Ensembl 98[3]. References for other organisms currently are not available in Flow Cell ranger, and will be coming in the future.If users don't have any options in the dropdown list, they can click Add annotation model (GTF file) for Index, or New assembly... (FASTA file)for Assembly and upload the files.
| Numbered figure captions | ||||
|---|---|---|---|---|
| ||||
|
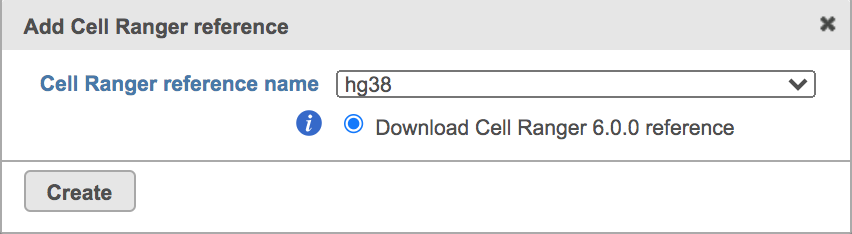
Once the right reference options has been chosen/provided, simply press the Create button to finish. The reference assembly of ‘hg38Homo sapiens (human) - hg38’ has been selected created as an example here (Figure 4).
| Numbered figure captions | ||||
|---|---|---|---|---|
| ||||
|
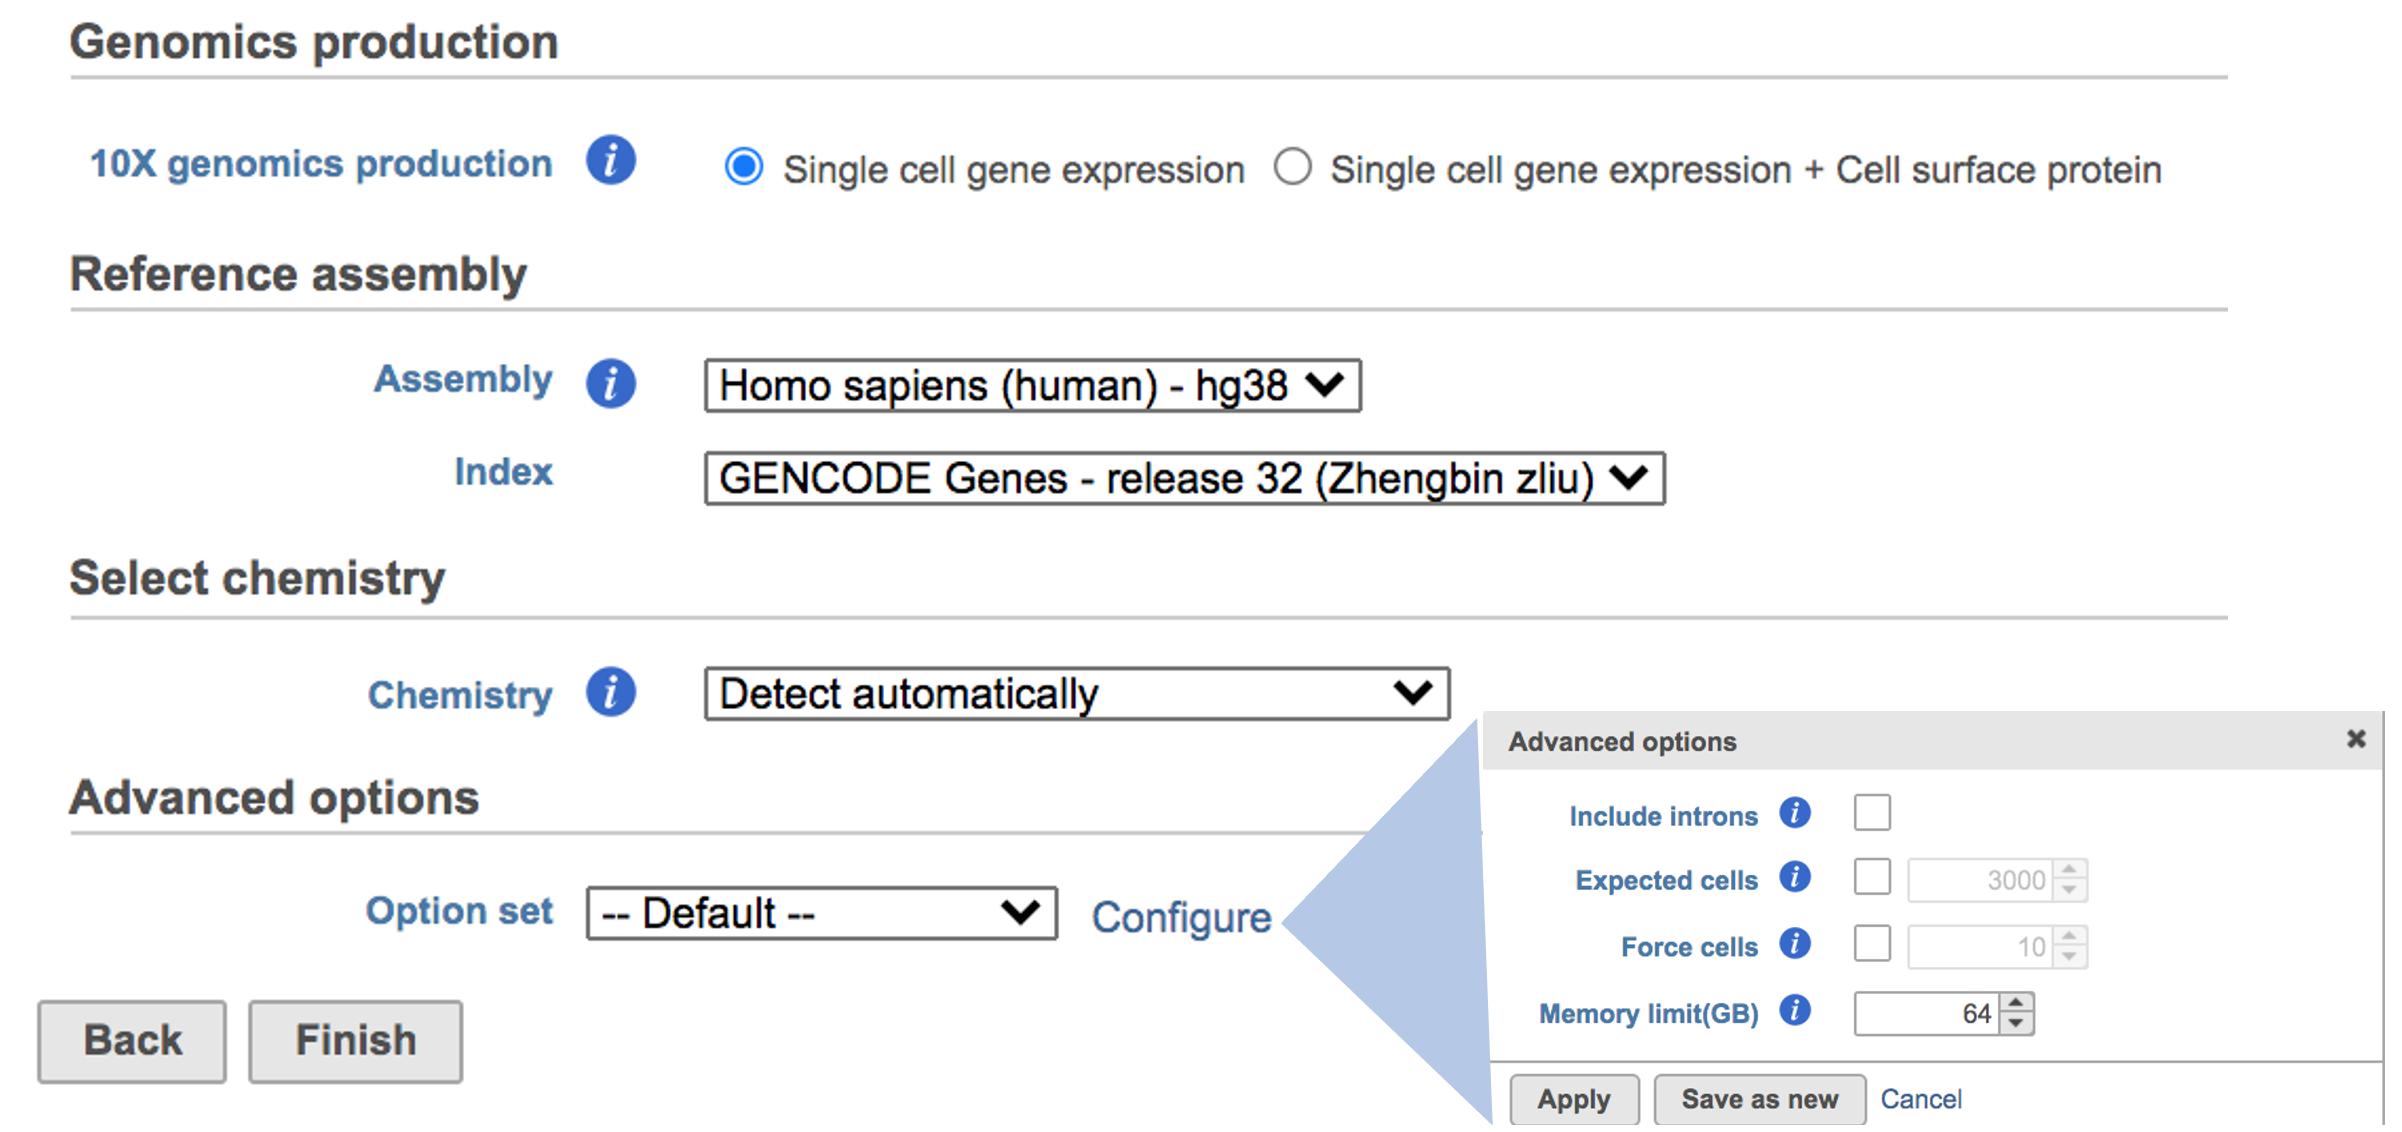
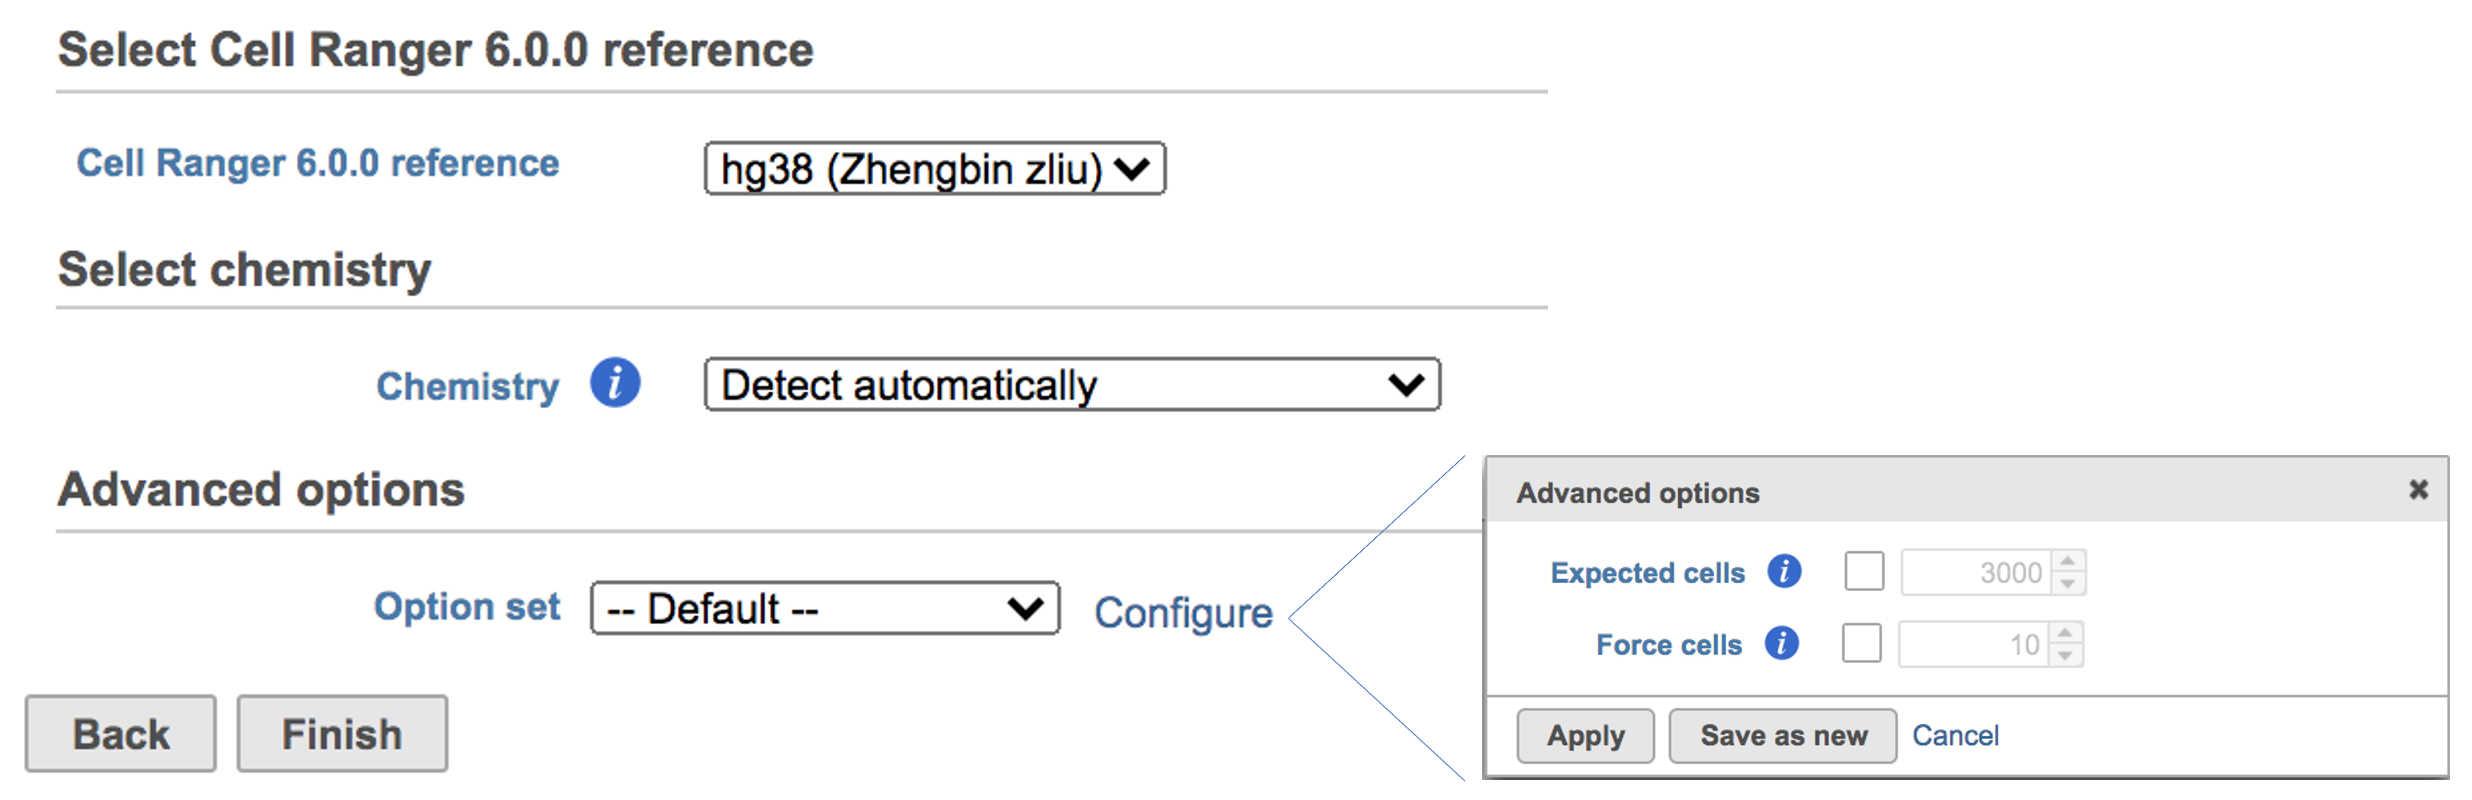
The main task menu will be refreshed as below above (Figure 54) for gene expression data if references have been added. After the correct reference has been selected, users Users can go ahead click the Finish button to run the task as default.
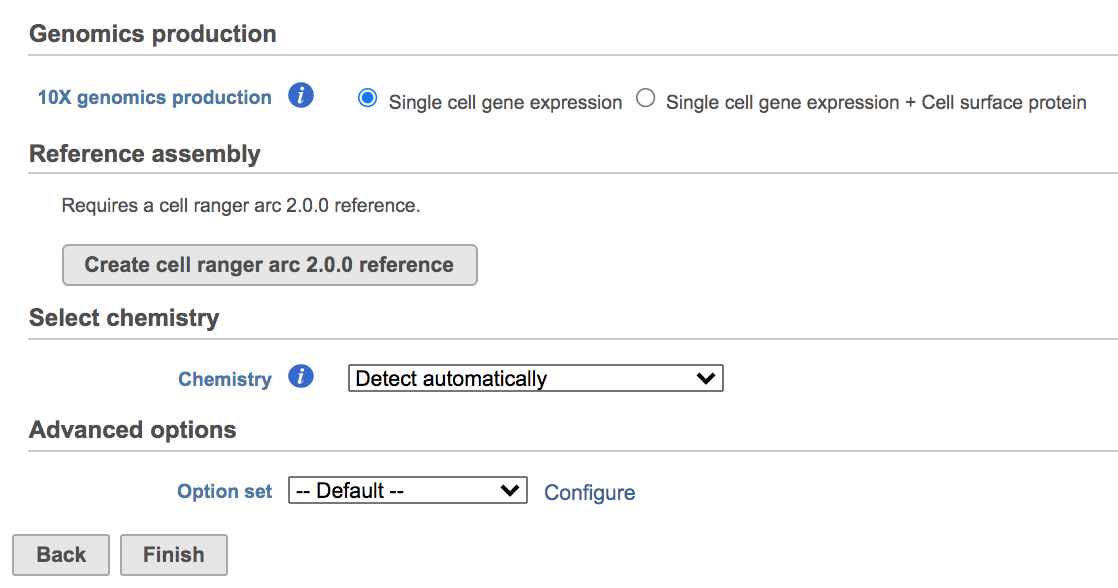
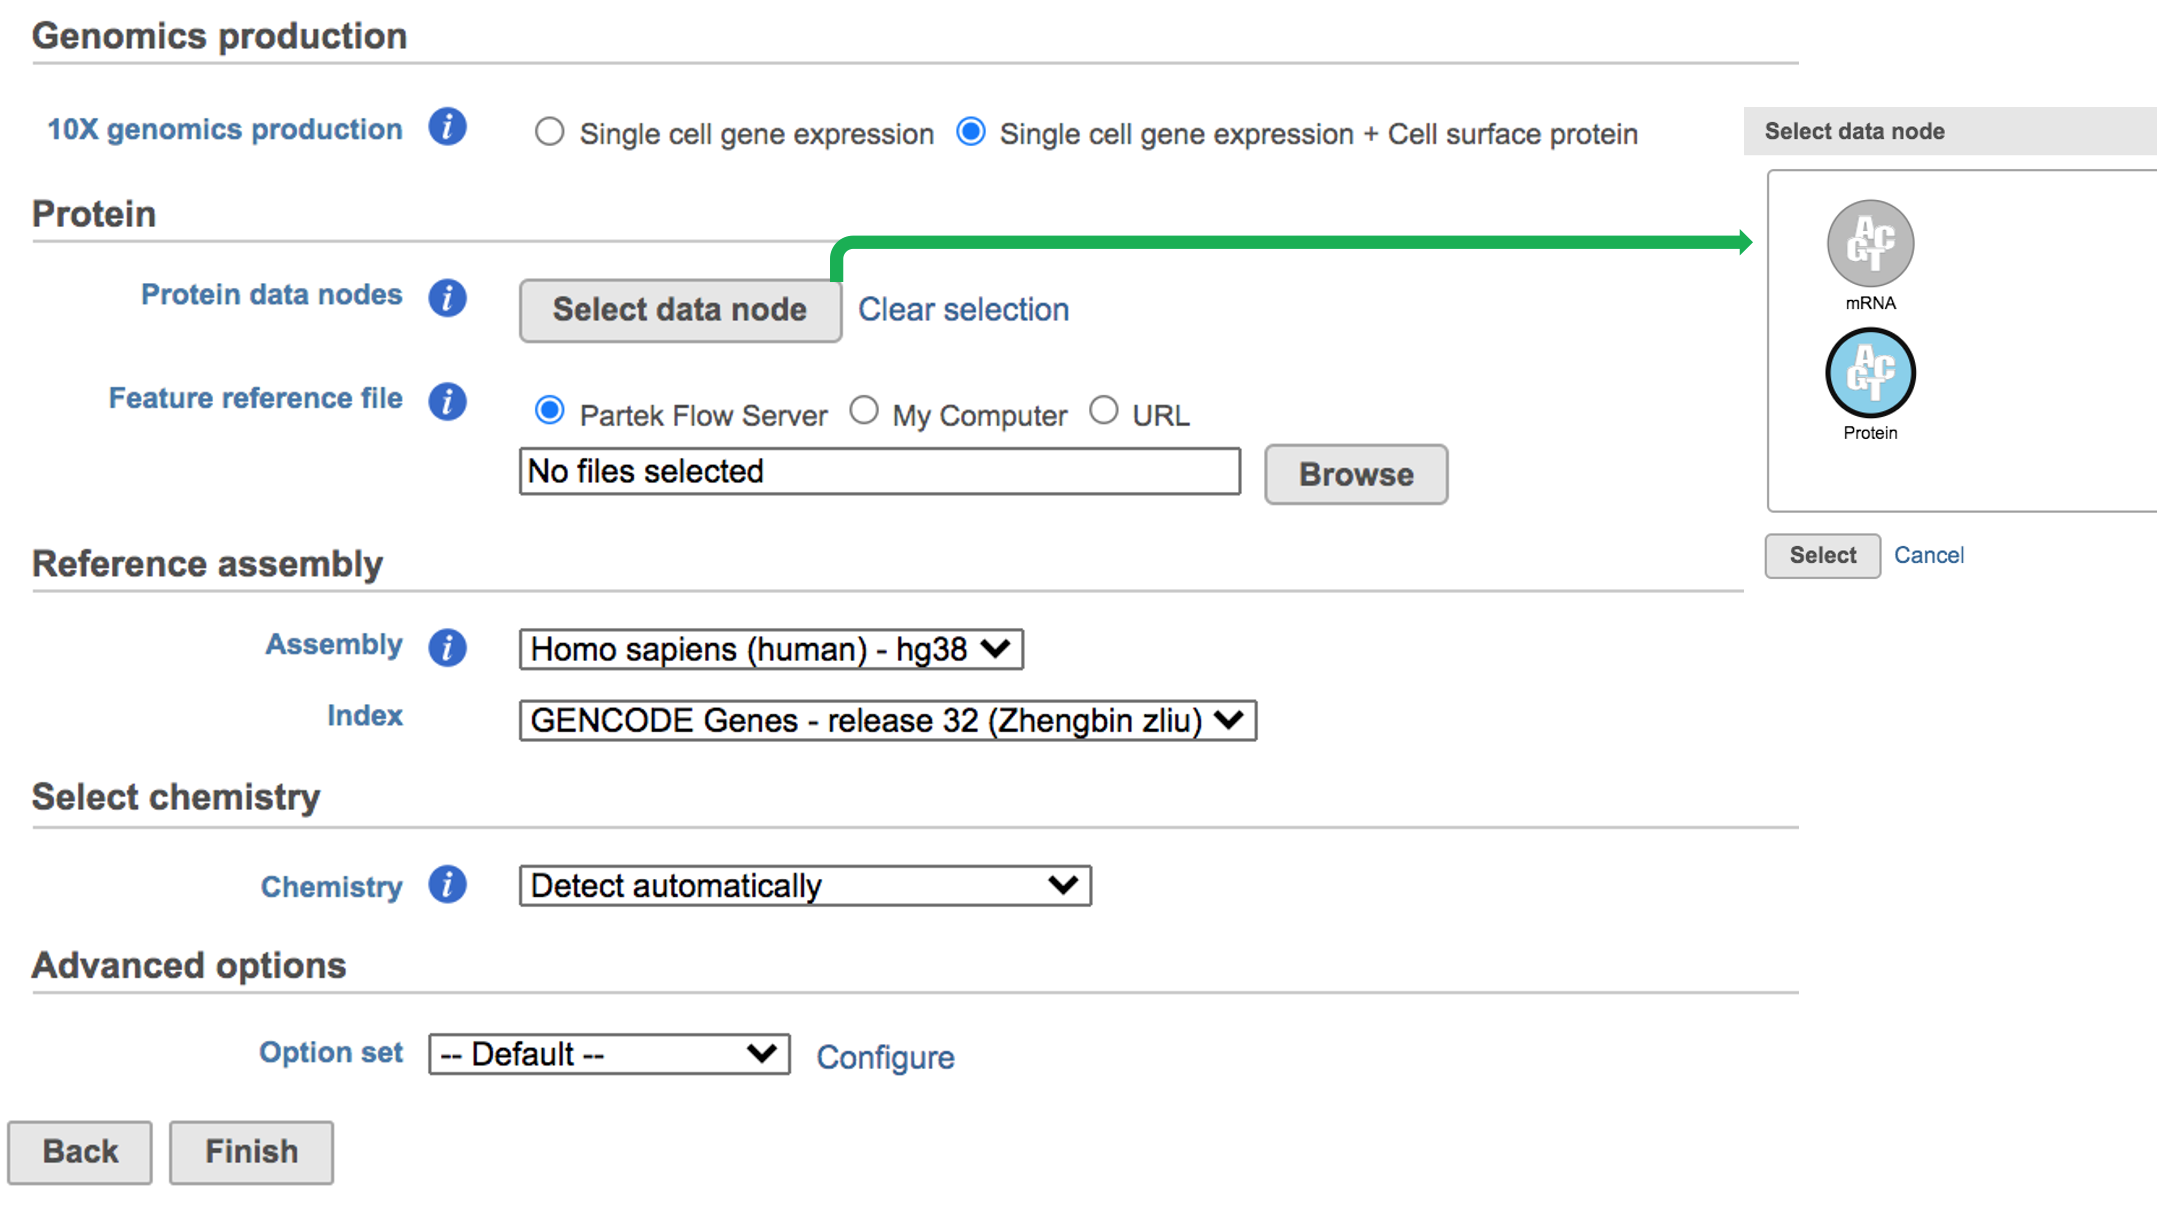
While for Feature Barcode data, there are more information needed besides reference assembly. An additional section of Protein has been added to the interface if Single cell gene expression + Cell surface protein has been selected for Feature Barcode data (Figure 5). Users need firstly push the button Select data node and select the correct data for feature of antibody capture or protein in a new pop-up window (top right, Figure 5). Then users need to upload the feature reference file (.csv) prepared for their datasets. A Feature Reference CSV file declares the molecule structure and unique Feature Barcode sequence of each feature present in the experiment. It should include at least six columns: id, name, read, pattern, sequence and feature_type. An example of TotalSeq™-B Feature Reference CSV has been linked here. Users can download it by clicking the link and use it as a template for their own data. But for more details, please refer to 10x Genomics webpage[4].
| Numbered figure captions | ||||
|---|---|---|---|---|
| ||||
|
A new data node named ‘Single Single cell counts’ will will be displayed in Flow if the task is running has been finished successfully (Figure 6). This data node contains a filtered feature barcode count matrix for gene expression data, but a unified feature-barcode matrix that contains gene expression counts alongside Feature Barcode counts for each cell barcode for Feature Barcode data. To open the task report when the task is finished, double click the output data node, or select the ‘Task report’ in in the Task results section after single clicking the data node. Users then will find the task report (Figure 7) is the same to the ‘Summary HTML’ from Cell Ranger output.
| Numbered figure captions | ||||
|---|---|---|---|---|
| ||||
|
Cell
...
Ranger - Gene Expression task report in Flow
Task report is sample based. Users can use the dropdown list on the top left to switch samples. Under the sample name, there are two tabs on each report - Summary report and Analysis report (Figure 7). Important information on Estimated Number of Cells, Mean Reads per Cell, Median Genes per Cell, as well as information on Sequencing, Mapping, and Sample are summarized in different panels. The Barcode Rank Plot has also been included as an important piece in the Cells panel in the Summary report (Figure 7).
...
| Numbered figure captions | ||||
|---|---|---|---|---|
| ||||
|
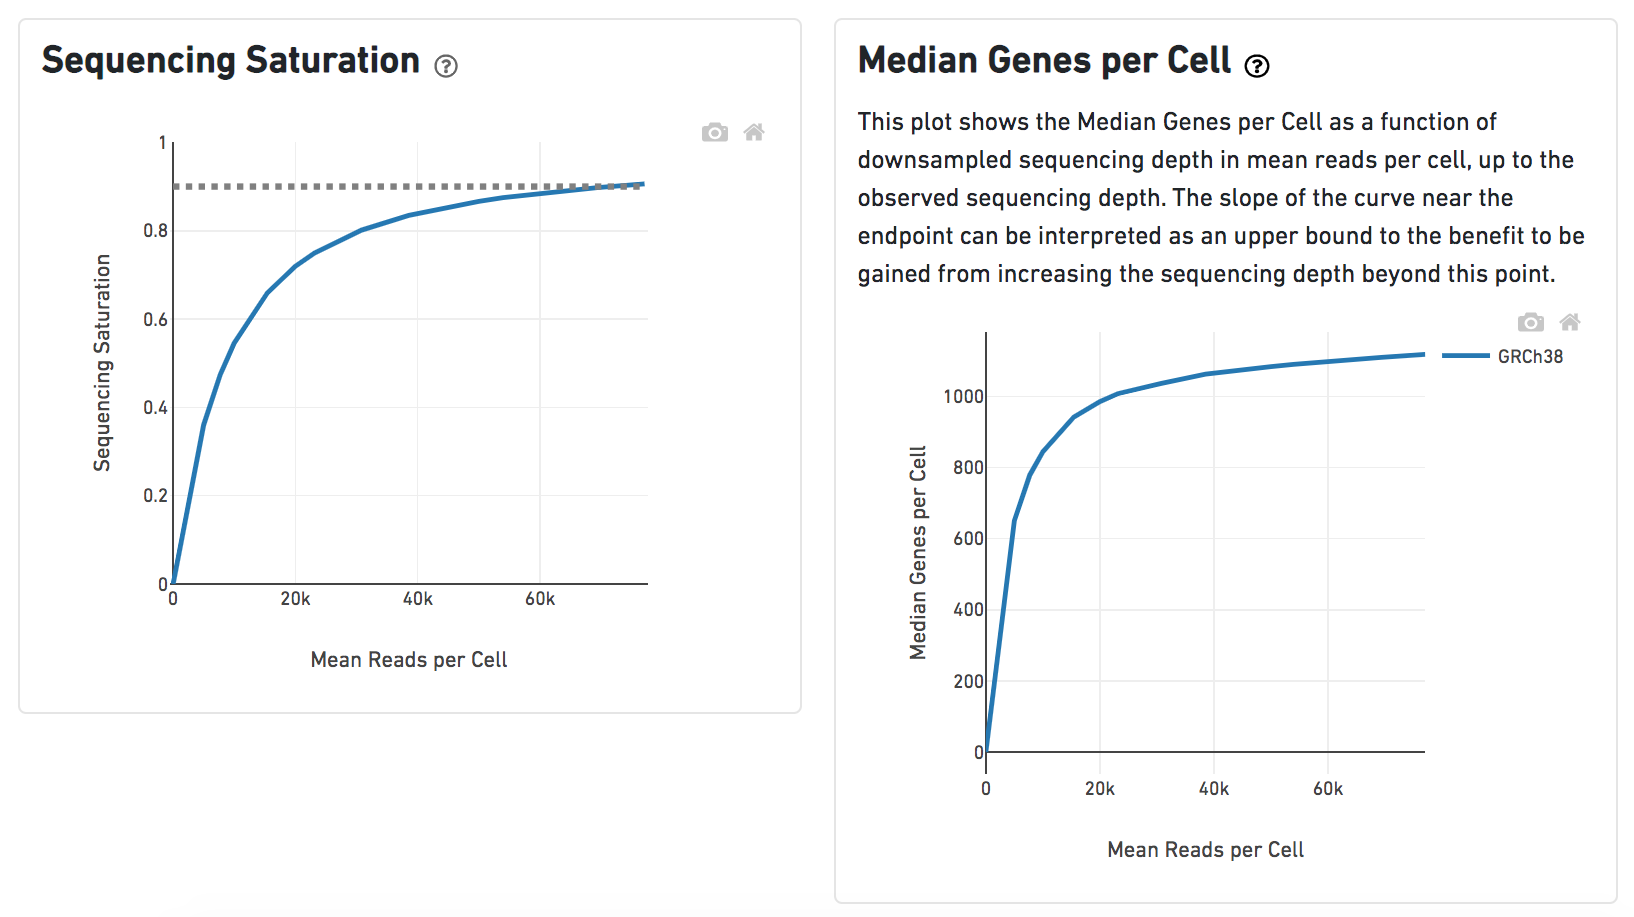
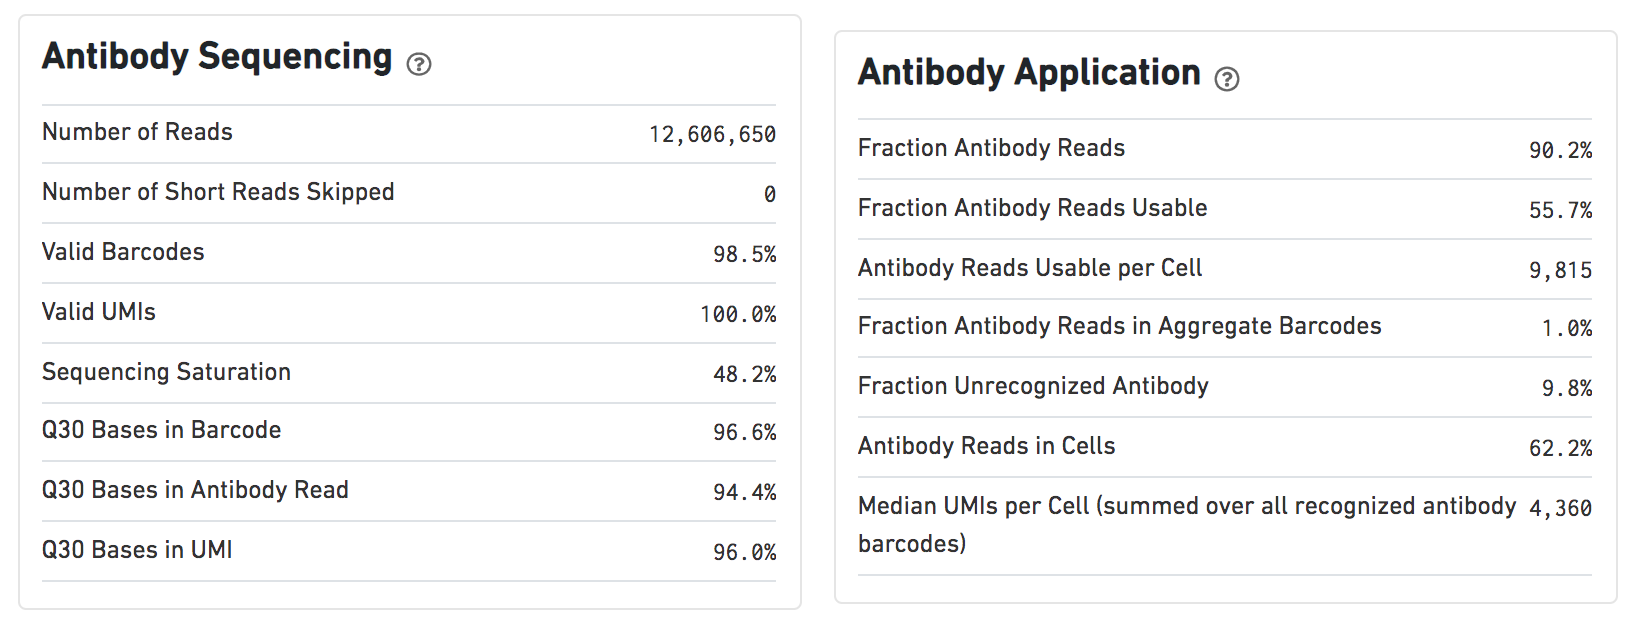
Other than two additional panels summarized information for Antibody Sequencing and Antibody Application have been added, the task report for Feature Barcode data is the same to scRNA-seq data report.
| Numbered figure captions | ||||
|---|---|---|---|---|
| ||||
|
Users can click Configure to change the default settings In in Advanced options (Figure 54).
Include introns: Count reads mapping to intronic regions. This may improve sensitivity for samples with a significant amount of pre-mRNA molecules, such as nuclei.
Expected cells: Expected number of recovered cells. Default: 3,000 cells.
Force cells: Force pipeline to use this number of cells, bypassing the cell detection algorithm. Use this if the number of cells estimated by Cell Ranger is not consistent with the barcode rank plot.
Memory limit (GB): Restricts Cell Ranger - Gene Expression to use specified amount of memory (in GB) to execute pipeline stages.
References
https://support.10xgenomics.com/single-cell-gene-expression/software/overview/welcome
https://support.10xgenomics.com/single-cell-gene-expression/software/pipelines/6.0/release-notes
- https://support.10xgenomics.com/single-cell-gene-expression/software/pipelines/4.0/release-notes
- https://support.10xgenomics.com/single-cell-gene-expression/software/pipelines/latest/using/feature-bc-analysis#feature-ref
| Additional assistance |
|---|
| Rate Macro | ||
|---|---|---|
|
...
Overview
Content Tools