Page History
...
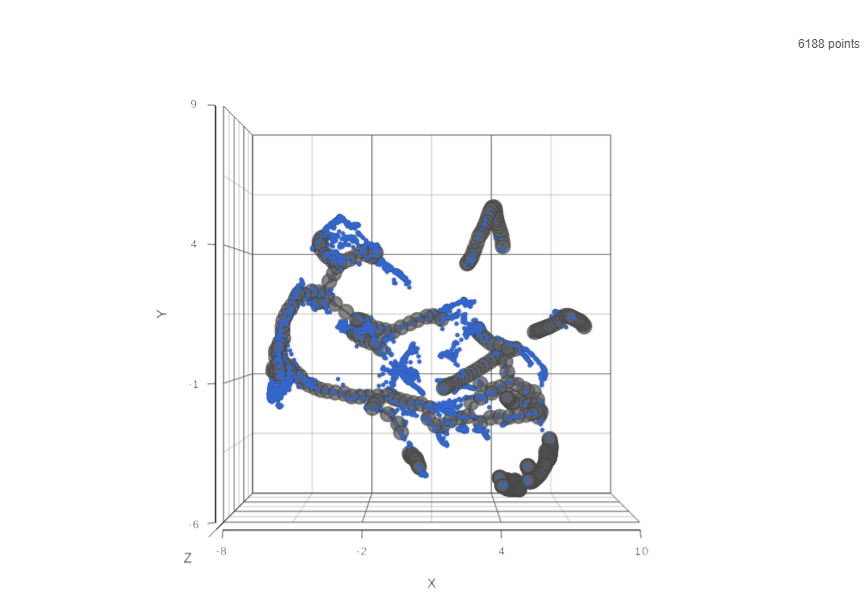
Result of running Trajectory analysis in Partek Flow is the Trajectory result data node. Double clicking on the node opens a Data Viewer window with the trajectory plot (Figure xxx). Cell trajectory graph . Blue dots are individual cells (total count is displayed in the upper right). Black line represents the structure of the trajectory graphshows position of each cell (blue dot) with respect to the UMAP coordinates (axes). Cell trajectories (one or more, depending on the data set) are depicted as black lines. Gray circles are trajectory nodes or leaves. The axes represent UMAP coordinates.(i.e. cell communities).
| Numbered figure captions | ||||
|---|---|---|---|---|
| ||||
|
To show / hide cell trajectory tree and trajectory nodes, use the Extra data option on the Content card (Figure xxx).
| Numbered figure captions | ||||
|---|---|---|---|---|
| ||||
|

| Additional assistance |
|---|
| Rate Macro | ||
|---|---|---|
|
...
Overview
Content Tools