Join us for a webinar: The complexities of spatial multiomics unraveled
May 2
Page History
...
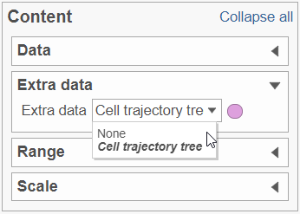
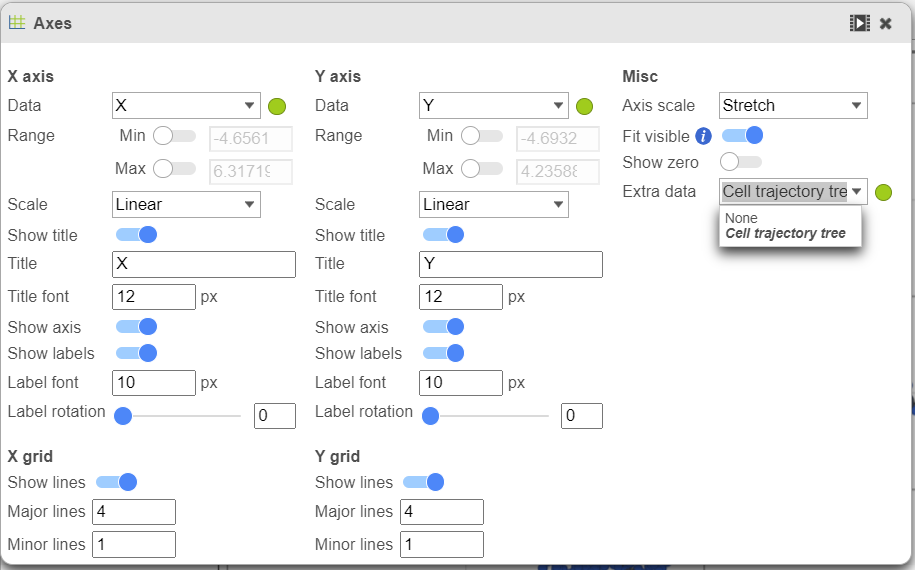
To show / hide cell trajectory tree and trajectory nodes, use the Extra data option on the Content card select Axes in Configure section and on the upper-right corner of the dialog, select the Extra data drop-down options (Figure 2).
| Numbered figure captions | ||||
|---|---|---|---|---|
| ||||
|
Pseudotime Analysis
...
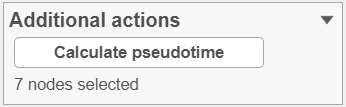
To start, select the root cell nodes (gray circles in trajectory tree) by left-clicking. If the trajectory result consists of more than one trajectory tree, you can specify more than one root node, e.g. one root node per trajectory tree (ctrl & click). If no root node is specified for a tree, that tree will not be included in the pseudotime calculation. Figure 4 shows an example where seven root nodes were identified.
...
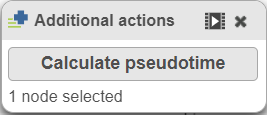
Once you have identified all the root nodes, click on Additional button in Tools section on the left panel, push the Calculate pseudotime button in the Selection panel dialog (Figure 5).
| Numbered figure captions | ||||
|---|---|---|---|---|
| ||||
|
As a result, the cells will be annotated by pseudotime, using green to red gradient (start and end, respectively) (Figure 6). If, for a particular tree, no root node has been identified, those cells will be omitted from the pseudotime calculation and will be colored in black (Figure 9).
...
Overview
Content Tools