Page History
...
| Table of Contents | ||
|---|---|---|
|
Invoking Hierarchical Clustering
To invoke hierarchical clustering, select a Quantification data node (to cluster samples) or a Feature list data node (to cluster significant genes/transcripts) and then click on the Hierarchical clustering option in the context sensitive menu (Figure 1).
...
You can choose how the data is normalized. Under the Normalization mode dropdown, Standardize (default) will make each column mean as zero and standard deviation as 1 in all features. This is the default normalization and it makes makes all the features (e.g., genes) have equal weight. The normalization mode Shift will make each column mean as zero. Choose None to perform clustering on the values in the quantified data node.
Heat Map
The output of a Hierarchical clustering task is a heat map (Figure 4) with or without dendrogram depends on whether you perform cluster on samples/cells or features. By default, samples are on rows (sample labels are displayed as seen in the Data tab) and features (genes or transcripts, depending on the input data) on columns. Colors are based on standardized expression values (default selection; performed on the fly), Dendrograms show clustering of rows (samples) and columns (variables).
...
| Numbered figure captions | ||||
|---|---|---|---|---|
| ||||
|
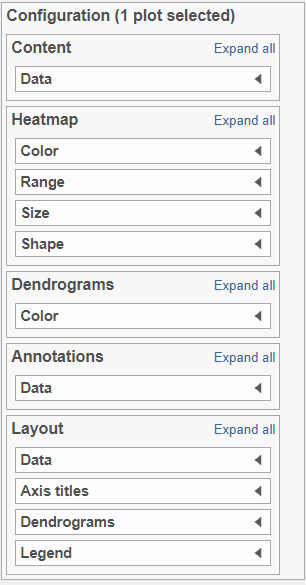
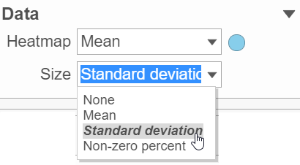
Content:
Content contains the value of which matrix data is used to draw heatmap in the plot. Heatmap is a color presentation of the values in the matrix selected. Most of the data nodes contains only one matrix, which you might not need to use Size by configuration to use the same value represent the same information as color by (Figure 6).
...
| Numbered figure captions | ||||
|---|---|---|---|---|
| ||||
|
Heatmap:
Heatmap section is used to configure the color and shape of the components in the heatmap (Figure 8)
...
The shape of the heatmap cell (component) can be configured either as rectangle or circle by selecting the radio button in the shape section.
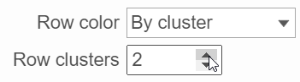
Dendrograms:
Only if cluster analysis is performed, the result will be displayed in dendrograms. By default, the dendrograms are all colored in black (Figure 4 ).
...
| Numbered figure captions | ||||
|---|---|---|---|---|
| ||||
|
Annotations:
Row annotation allow to add sample or cell level annotation to the viewer. First make sure to choose the correct data node which contains the annotation information you would like to use by clicking the circle (![]() ). All project level annotation will be available on all data node in the pipeline (Figure 14).
). All project level annotation will be available on all data node in the pipeline (Figure 14).
...
Each attribute is represented as an annotation bar next to the heatmap, different color represent different group in the attribute. The width of the bar can be adjusted by Block size slider, when the show labels toggle switch is on , the text of the label font size can be changed by specifying pixel size.
Layout
To change the orientation of the plot, click on the toggle switch of Data Transpose (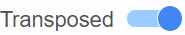 )in the Layout section (Figure 15)
...
Overview
Content Tools