Page History
...
| Numbered figure captions | ||||
|---|---|---|---|---|
| ||||
|
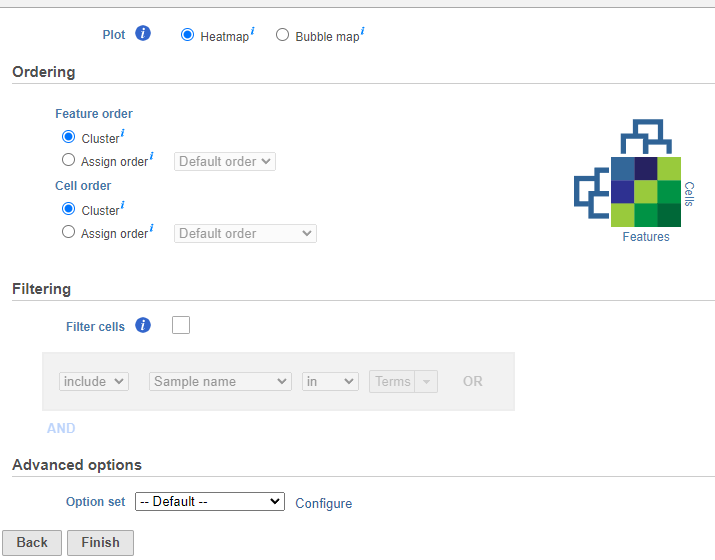
The hierarchical clustering setup dialog (Figure 2) enables you to control the clustering algorithm. Starting from the top, you can choose to plot a Heatmap or a Bubble map (clustering can be performed on both plot types). Next, perform Ordering by selecting Cluster for either feature order (genes/transcripts/proteins) or cell/sample/group order or both. Note the context-sensitive image that helps you decide to either perform hierarchical clustering (dendrogram) or assign order (arrow) for the columns and rows to help you orient yourself and make decisions (In Figure 2 below, Cluster is selected for both options so a dendrogram is shown in the image).
...
| Numbered figure captions | ||||
|---|---|---|---|---|
| ||||
|
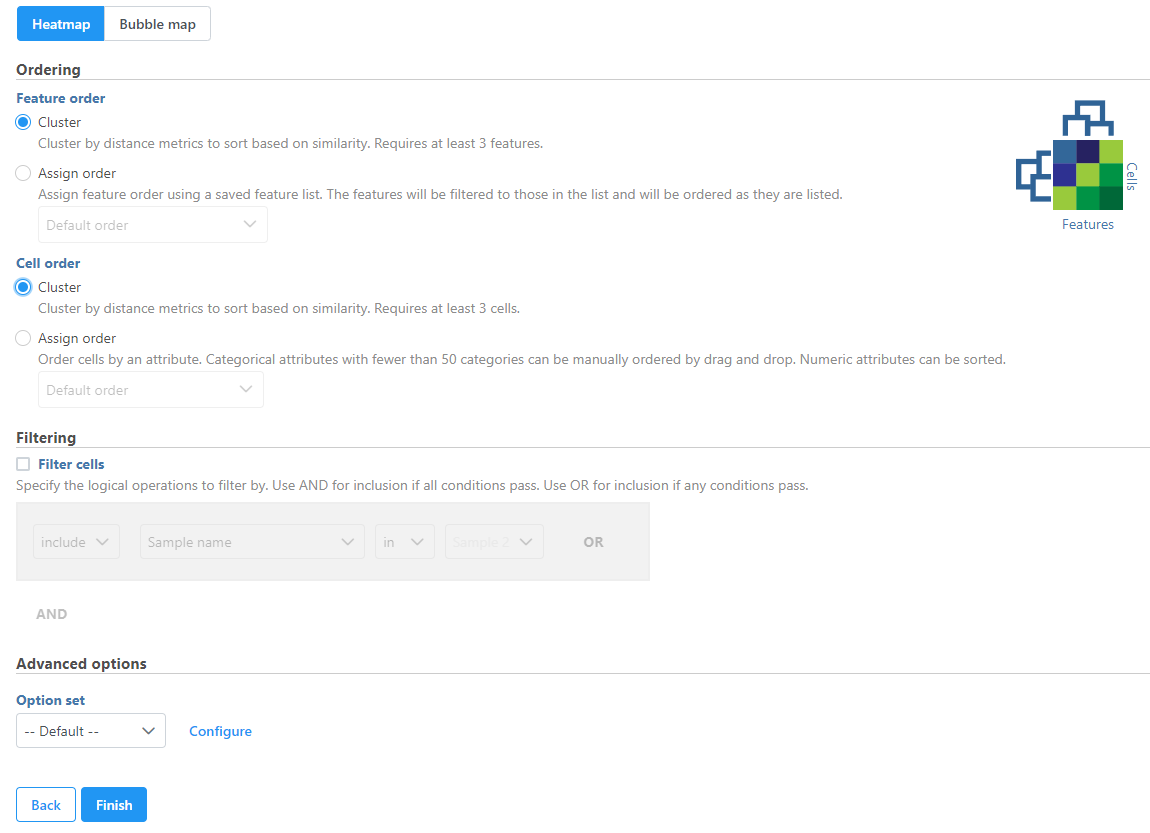
When choose Assign order, the Default order of cells/samples/groups (rows) is based upon the labels as displayed in the Data tab and features (columns) are dependent on the input data of the data node.
...
Overview
Content Tools