Page History
...
| Numbered figure captions | ||||
|---|---|---|---|---|
| ||||
|
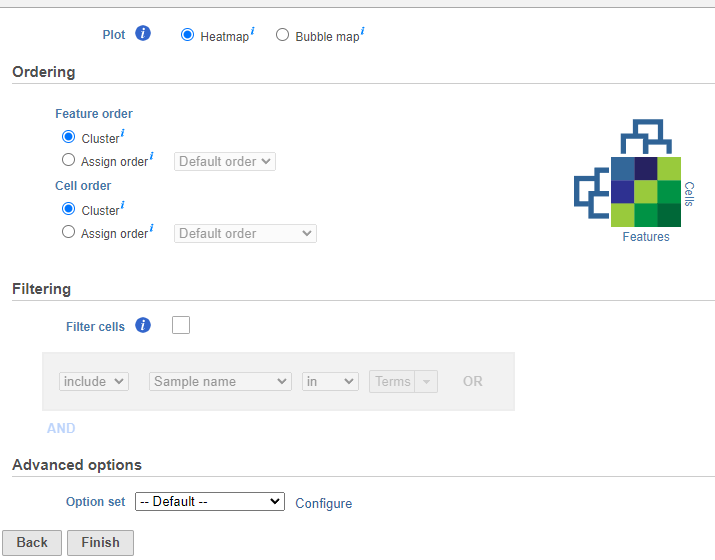
The hierarchical clustering setup dialog (Figure 2) enables you to control the clustering algorithm. Starting from the top, you can choose to plot a Heatmap or a Bubble map (clustering can be performed on both plot types). Next, perform Ordering by selecting Cluster for either feature order (genes/transcripts/proteins) or cell/sample/group order or both. Note the context-sensitive image that helps you decide to either perform hierarchical clustering (dendrogram) or assign order (arrow) for the columns and rows to help you orient yourself and make decisions (In Figure 2 below, Cluster is selected for both options so a dendrogram is shown in the image).
...
| Numbered figure captions | ||||
|---|---|---|---|---|
| ||||
|
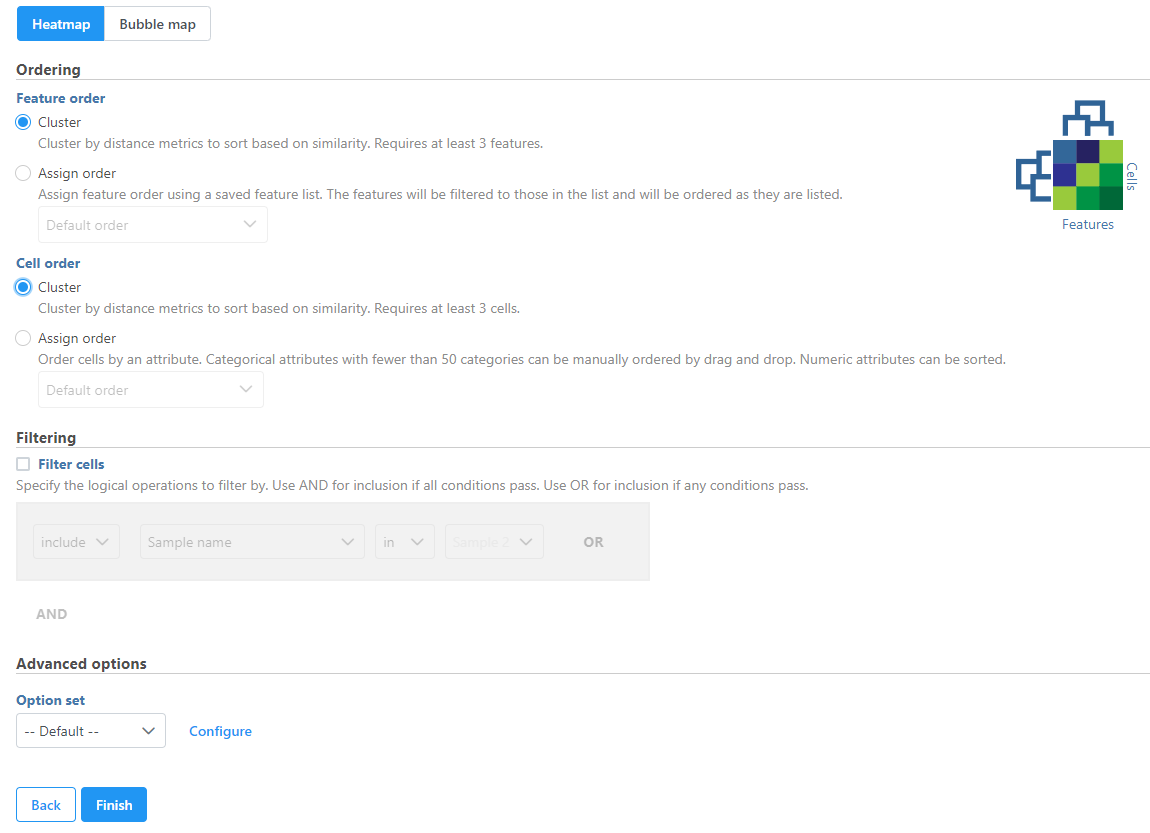
When choose Assign order, the Default order of cells/samples/groups (rows) is based upon the labels as displayed in the Data tab and features (columns) are dependent on the input data of the data node.
...
- In point mode (
 ), you can left-click and drag to move around the heatmap (if you are not fully zoomed out). Left-clicking once on the heatmap or on a dendrogram branch will select the associated rows/columns.
 - In selection mode (
 ), you can click and drag to select a range of rows, columns, or components.
 - In flip mode (
 ), you can click on a line in the dendrogram (which represents a cluster branch) and the location of the two legs of the branch will be swapped. If no clustering is performed (no dendrogram is generated), in this mode, you can click on the label of an item (observation or feature), drag and drop to manually switch orders of the row or column on the heatmap.
 - Click on rest reset view (
 ) to rest reset to the default
 - Save Image icon (
 ) enables you to download the heat map to your local computer. If the heat map contains up to 2.5M cells (features * observations), you can choose between saving the current appearance of the heat map window (Current view) and saving the entire heat map (All data). Depending on the number of features / observations, Partek Flow may not be able to fit all the labels on the screen, due to the limit imposed by the screen resolution. All Data option provides an image file of sufficient size so that all the labels are readable (in turn, that image may not fit the compute screen and the image file may be quite large). If the heat map exceeds 2.5M cells, the Current view option will not be shown, and you will see only a dialog like the one below.
...
Overview
Content Tools