Join us for a webinar: The complexities of spatial multiomics unraveled
May 2
Page History
...
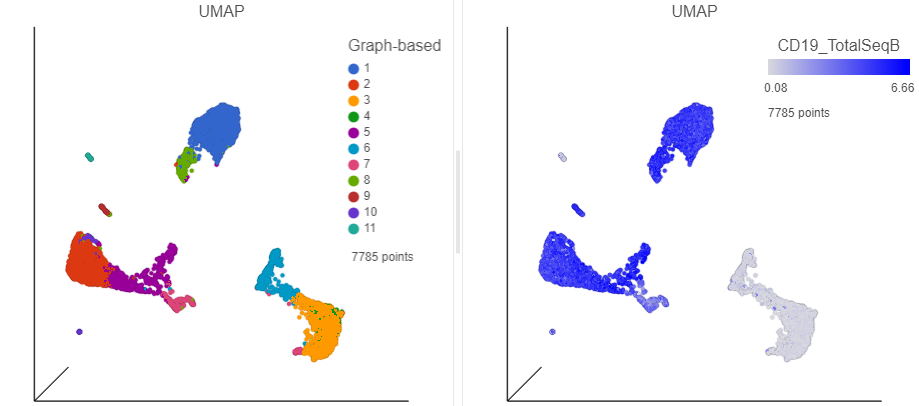
In addition to T-cells, we would expect to see B lymphocytes, at least some of which are malignant, in a MALT tumor sample. We can color the plot by expression of a B cell marker to locate these cells on the UMAP plot.
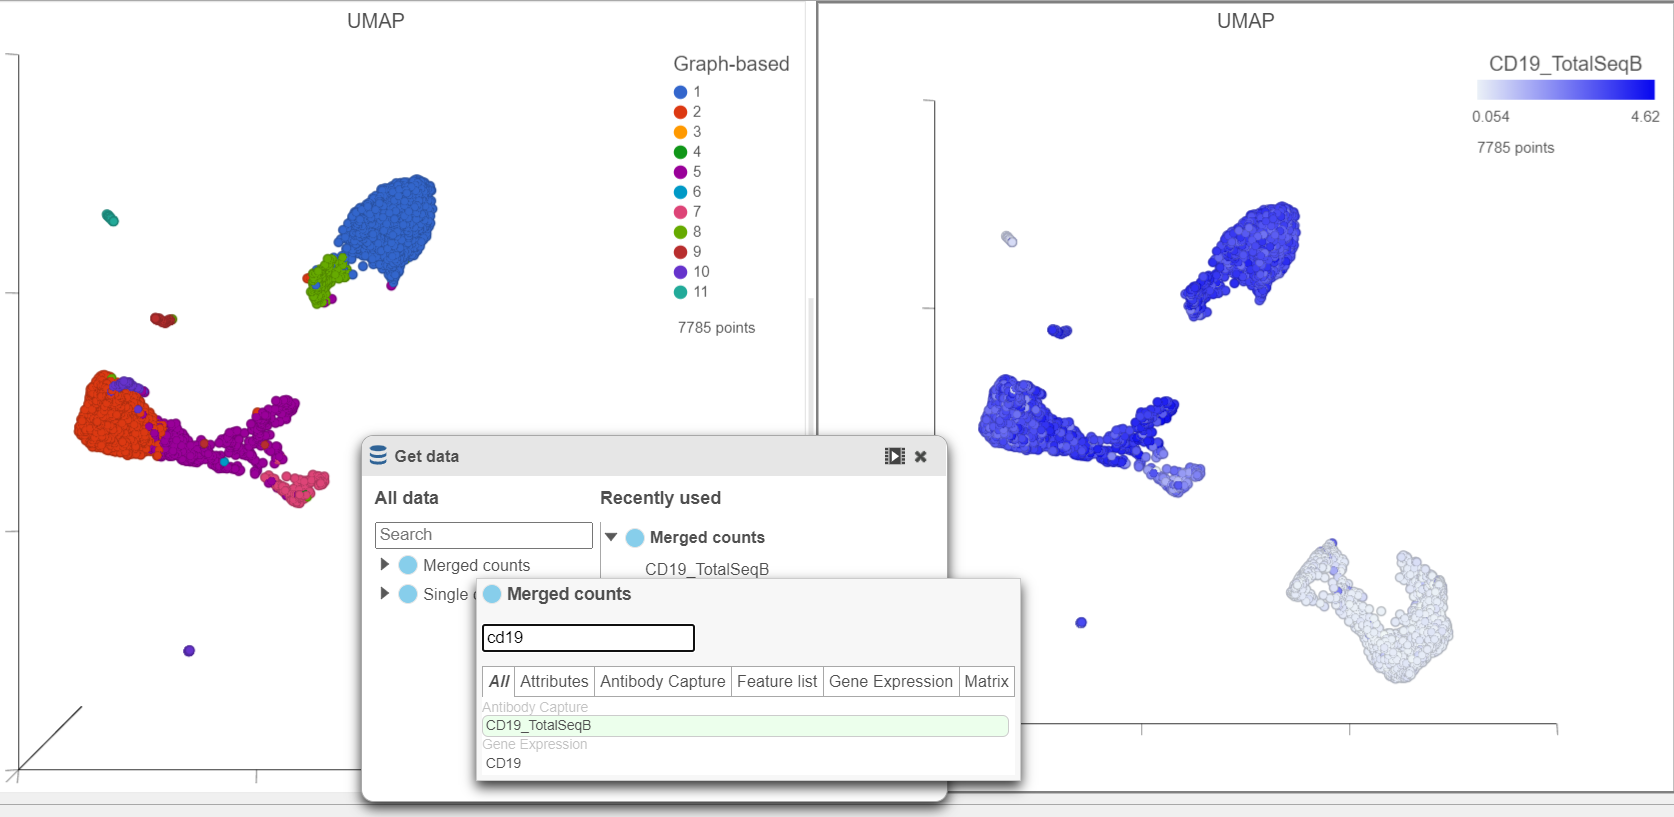
- In the Data card on Get data icon on the left, click Merged counts
- Scroll down and or use the search bar to find the CD19_TotalSeqB protein marker
- Click and drag the CD19_TotalSeqB marker over to the UMAP plot on the right
- Drop the CD19_TotalSeqB marker over the Color configuration option on the plot
...
| Numbered figure captions | ||||
|---|---|---|---|---|
| ||||
|
- Click
 in the top right corner of the UMAP plot
 - Lasso around the CD19 positive cells (Figure 25)
- Click
in the Filtering card on the right to Select & Filter to include the selected points
...
- Select either of the UMAP plots
- Click on the Selection card on the right Select & Filter
- Click to select cluster 6 and 7
- In the Classification card on the right, Click the Classify icon then click Classify selection
- Label the cells as Doublets
- Click Save
- Click
 in the Filtering card on the right to Select & Filter to exclude the selected points
...
- Click
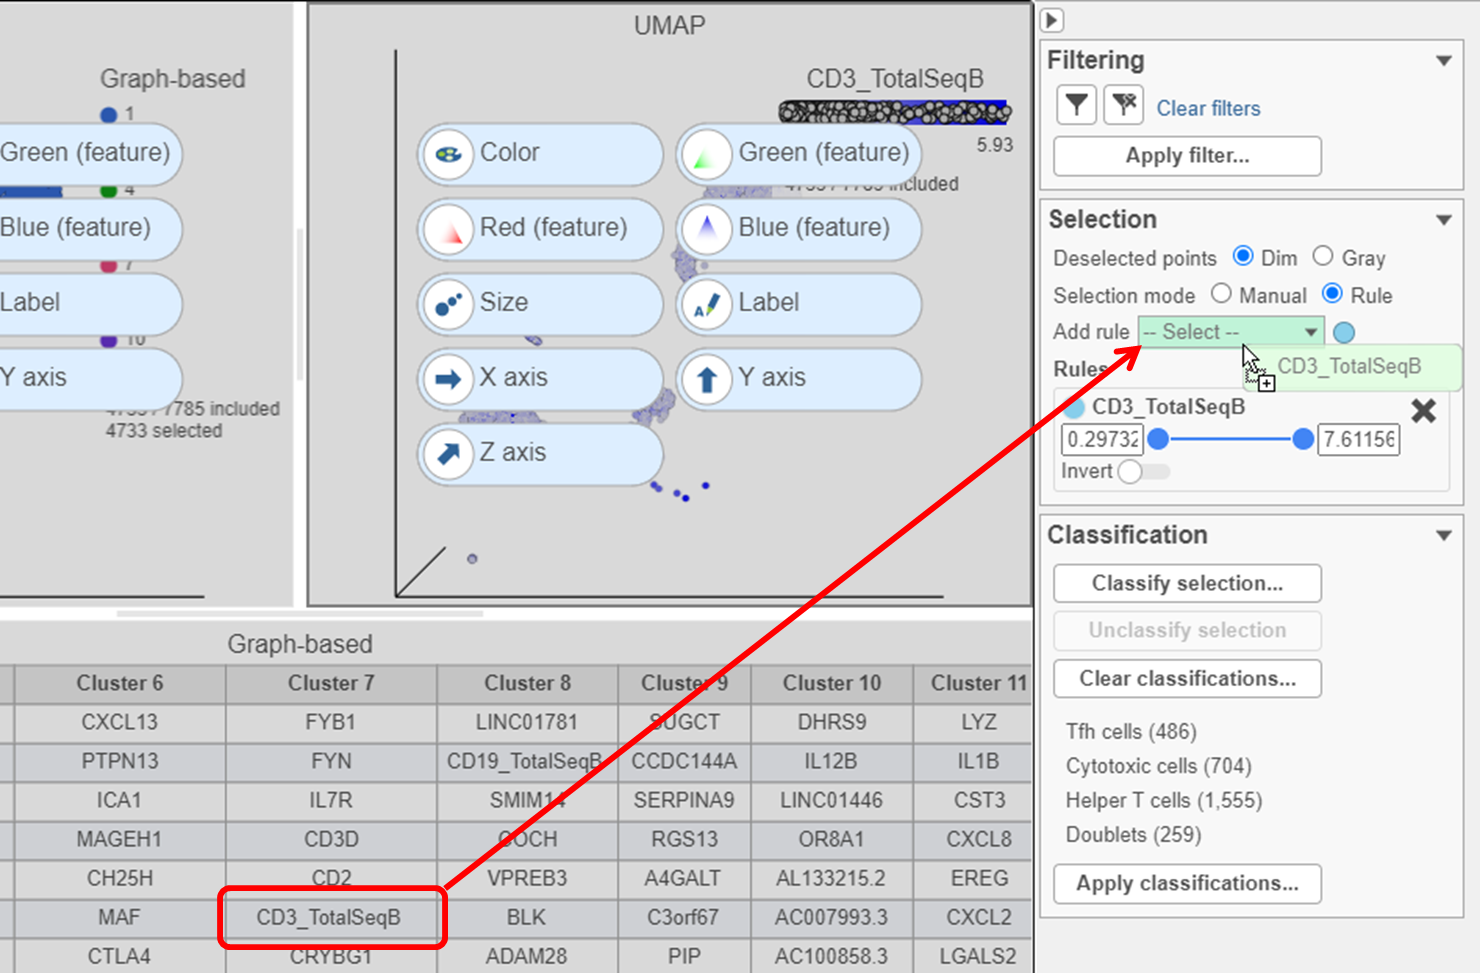
- Find the CD3_TotalSeqB protein marker in the biomarker table
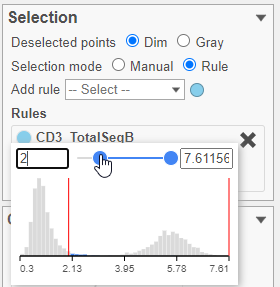
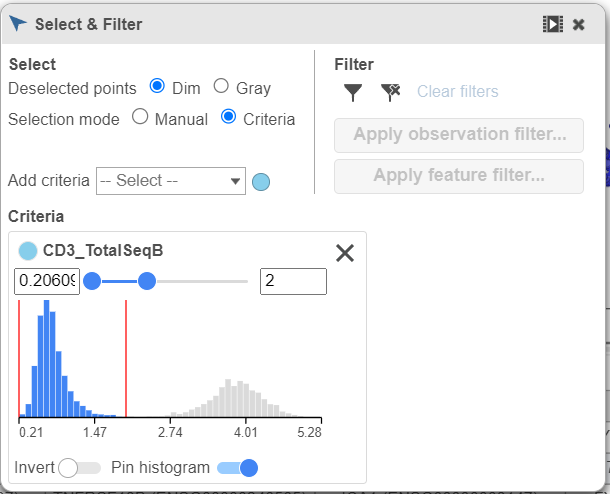
- Click and drag CD3_TotalSeqB onto the Add rule criteria drop-down list in the Selection card Select & Filter (Figure 28)
| Numbered figure captions | ||||
|---|---|---|---|---|
| ||||
|
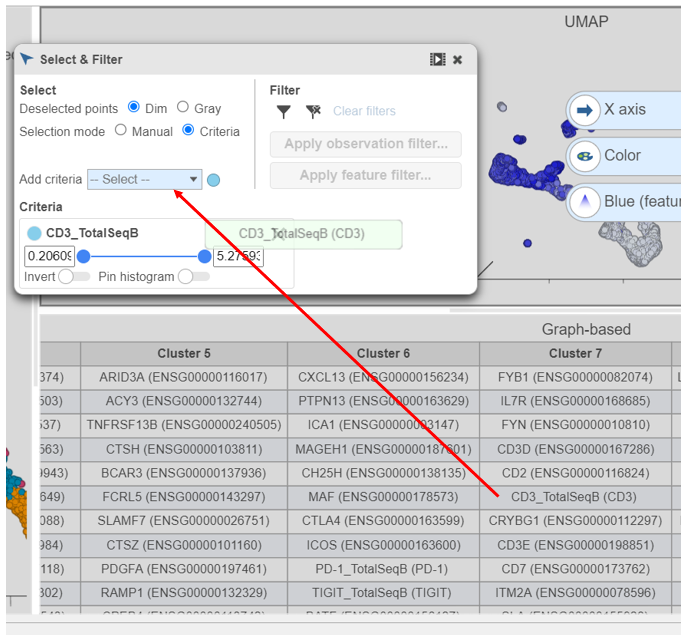
- Set the minimum threshold to 2 in the CD3_TotalSeqB selection rule (Figure 29)
| Numbered figure captions | ||||
|---|---|---|---|---|
| ||||
|
- In the Classification card on the right Classify icon, click Classify selection
- Choose Doublets from the drop-down list of cell labels
- Click Save
- Click in the Filtering card on the right Select & Filter icon to exclude the selected points
...
- Click
 in the top right corner of the UMAP plot
 - Lasso around the IGHD positive cells (Figure 31)
- In the Classification card Classify icon on the rightleft, click Classify selection
- Label the cells as Mature B cells
- Click Save
...
- Lasso around the IGHA1 positive cells (Figure 32)
- In the Classification card Classify icon on the rightleft, click Classify selection
- Label the cells as Activated B cells
- Click Save
...
- Click the Clear filters link in the Filtering card Select & Filter icon on the rightleft
- Select the duplicate UMAP plot (with the cell colored by marker genes)
- In the Configuration card on the Under Configure on the left, expand click the Color card Style icon and color the cells by New classifications (Figure 33)
...
- Click Apply classifications in the Classification card on the right Classify icon
- Choose the Merged counts data node as input for the classification task (Figure 34)
...
Overview
Content Tools