Page History
ChIP-Seq and ATAC-Seq identify enriched regions or peaks in genome. Depending on the assay, the biological meaning of enrichment changes; in ChIP-Seq, enrichment indicates protein binding, while in ATAC-Seq, enrichment indicates open chromatin. To understand the importance of enriched regions in regulating gene expression, we can add information about overlapping or nearby genomic features.
What is Annotate peaks?
Annotate peaks takes an input set of regions and checks for overlap between those regions and a gene/feature annotation. This gives regulatory context for enriched regions.
Running Annotate peaks
The input for Annotate peaks is a Peaks type data node.
...
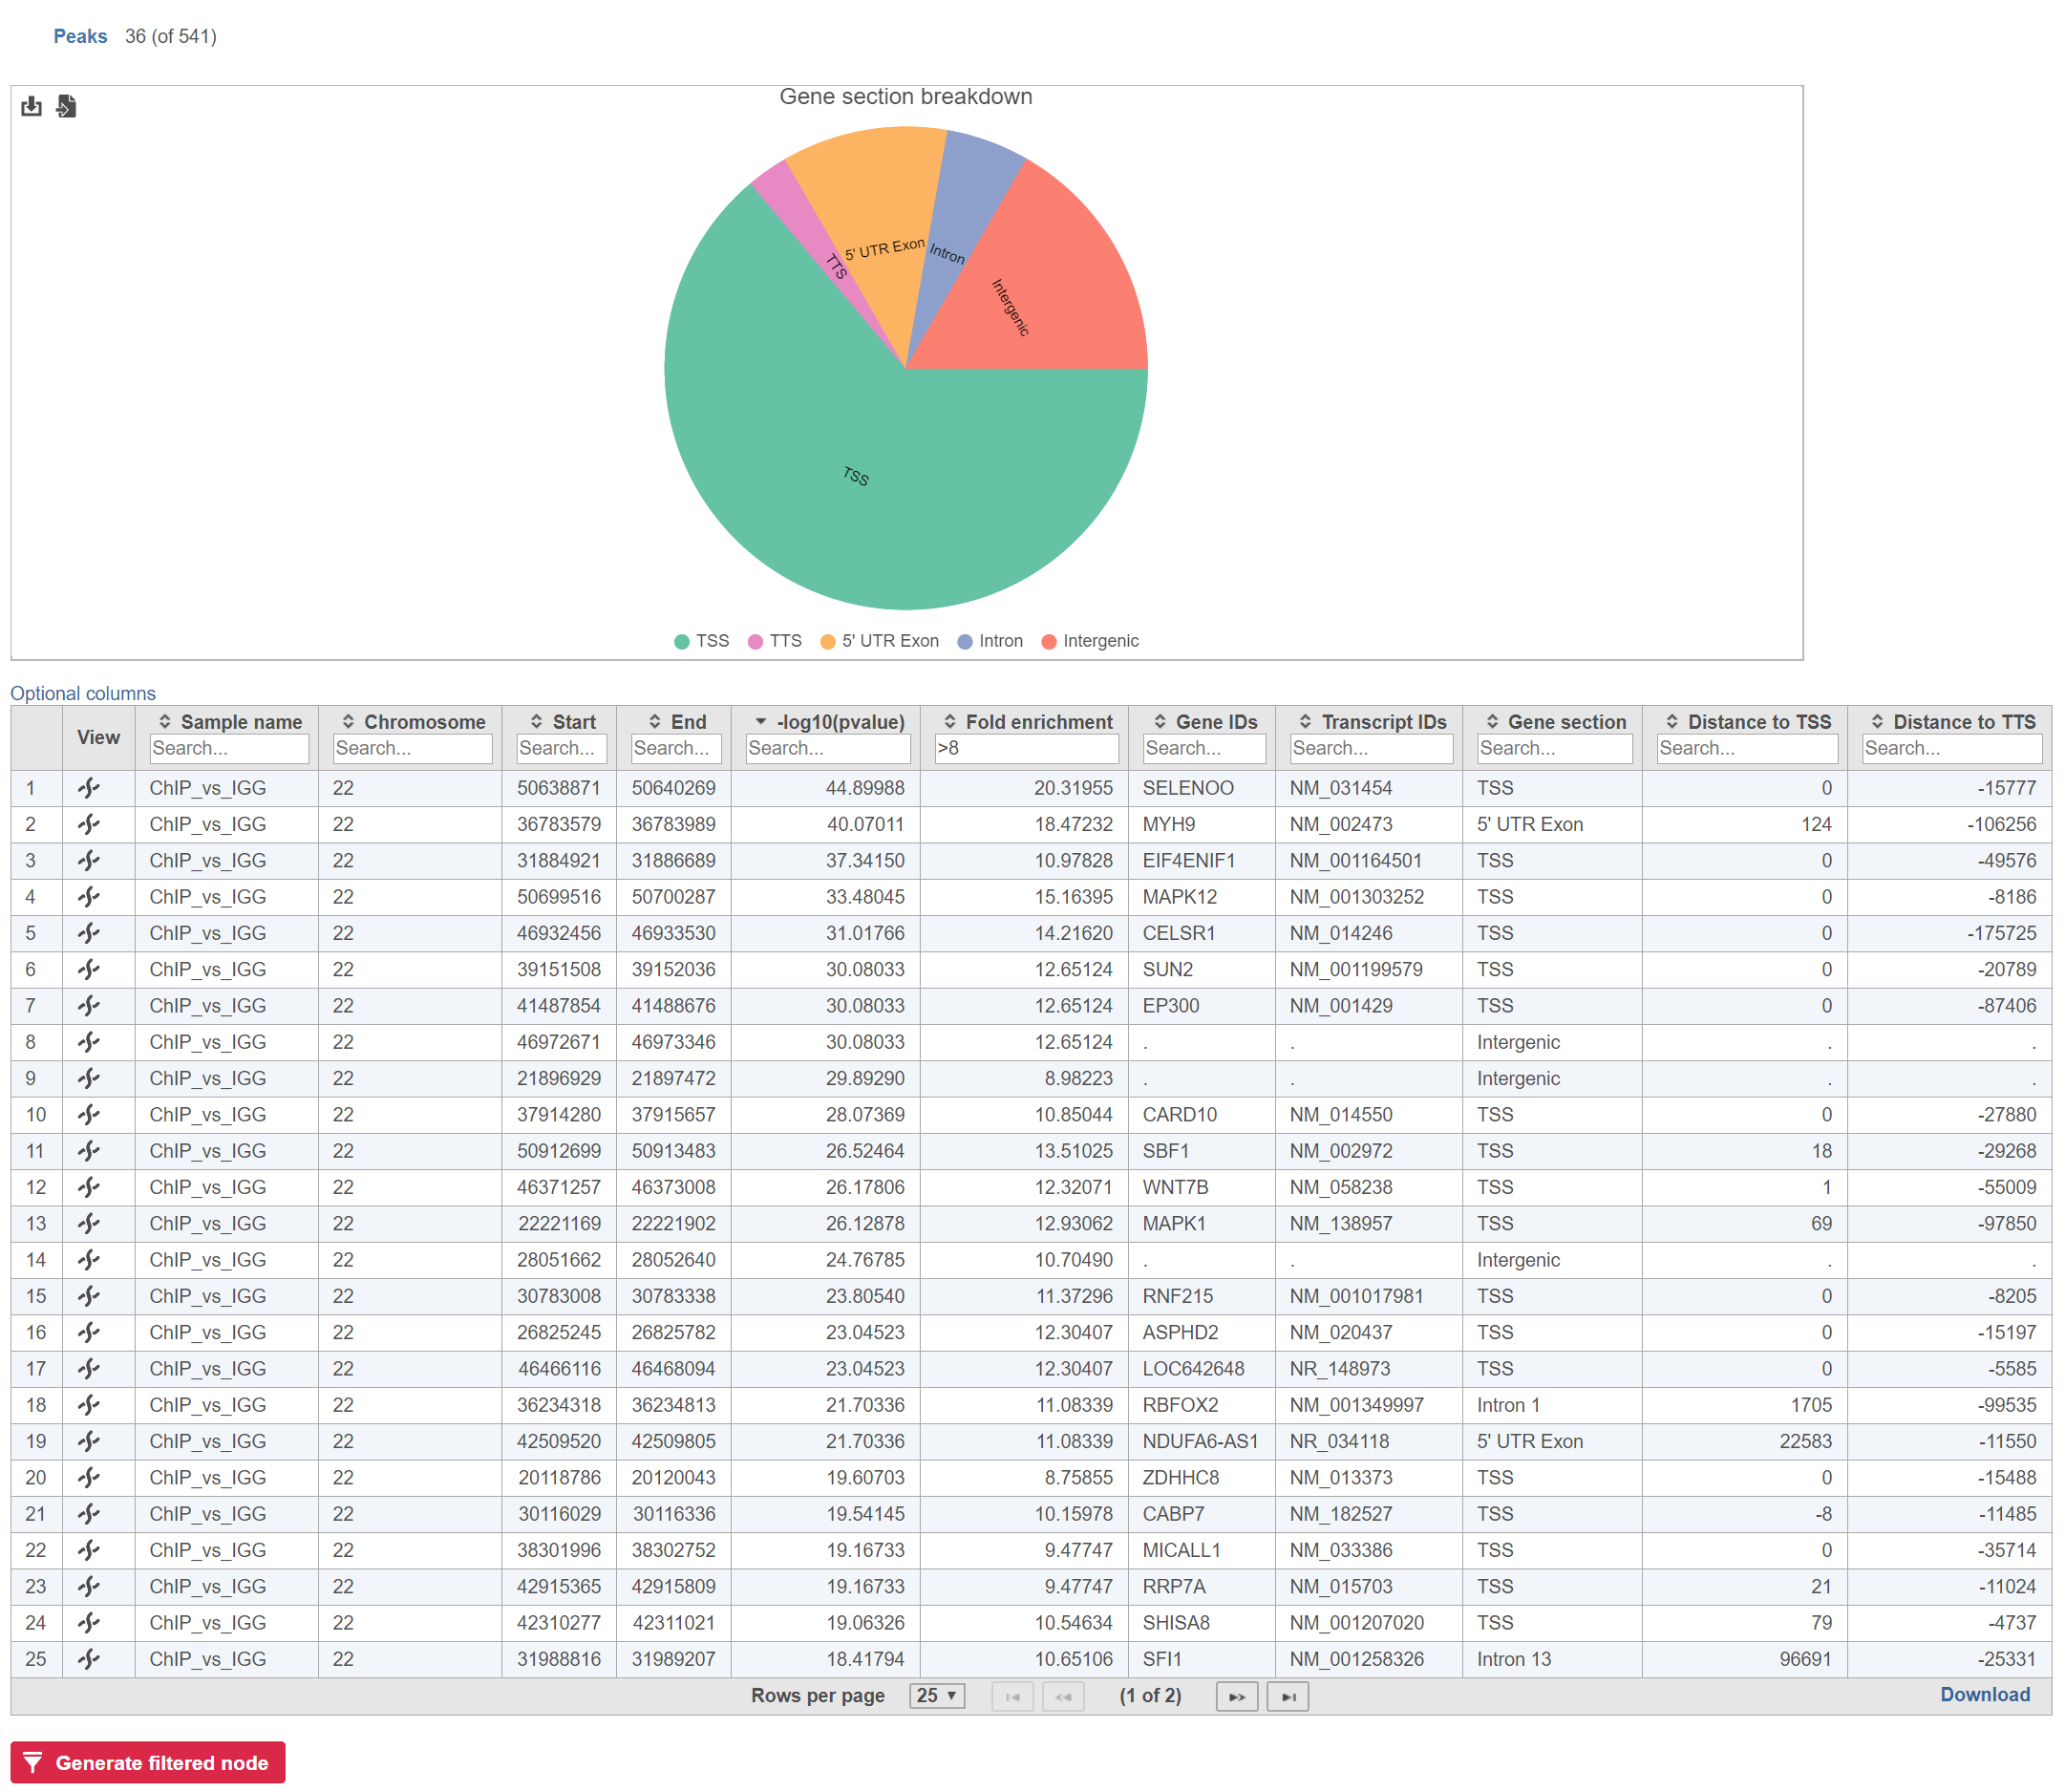
Annotate peaks produces an Annotated peaks data node. The Annotated peaks task report adds a Gene section breakdown pie chart and adds columns with information about the Gene IDsIDs, Transcript IDsIDs, Gene section, Distance to TSS, and Distance to TTS of each peak to the standard Peaks report (Figure 1). If run with the option to report all gene sections selected, each peak will have a row for each gene section it overlaps. If run with the option to report one gene section selected, each peak will have one row with the gene section it overlaps chosen using the order of precedence.
...
The table can be sorted and filtered by any of its columns (Figure 2). The Gene section breakdown pie chart will update as the table is filtered (the current (Peaks) and the total number of peaks (in parenthesis) are given in the upper left corner).
| Numbered figure captions | ||||
|---|---|---|---|---|
| ||||
...
