Join us for a webinar: The complexities of spatial multiomics unraveled
May 2
Page History
...
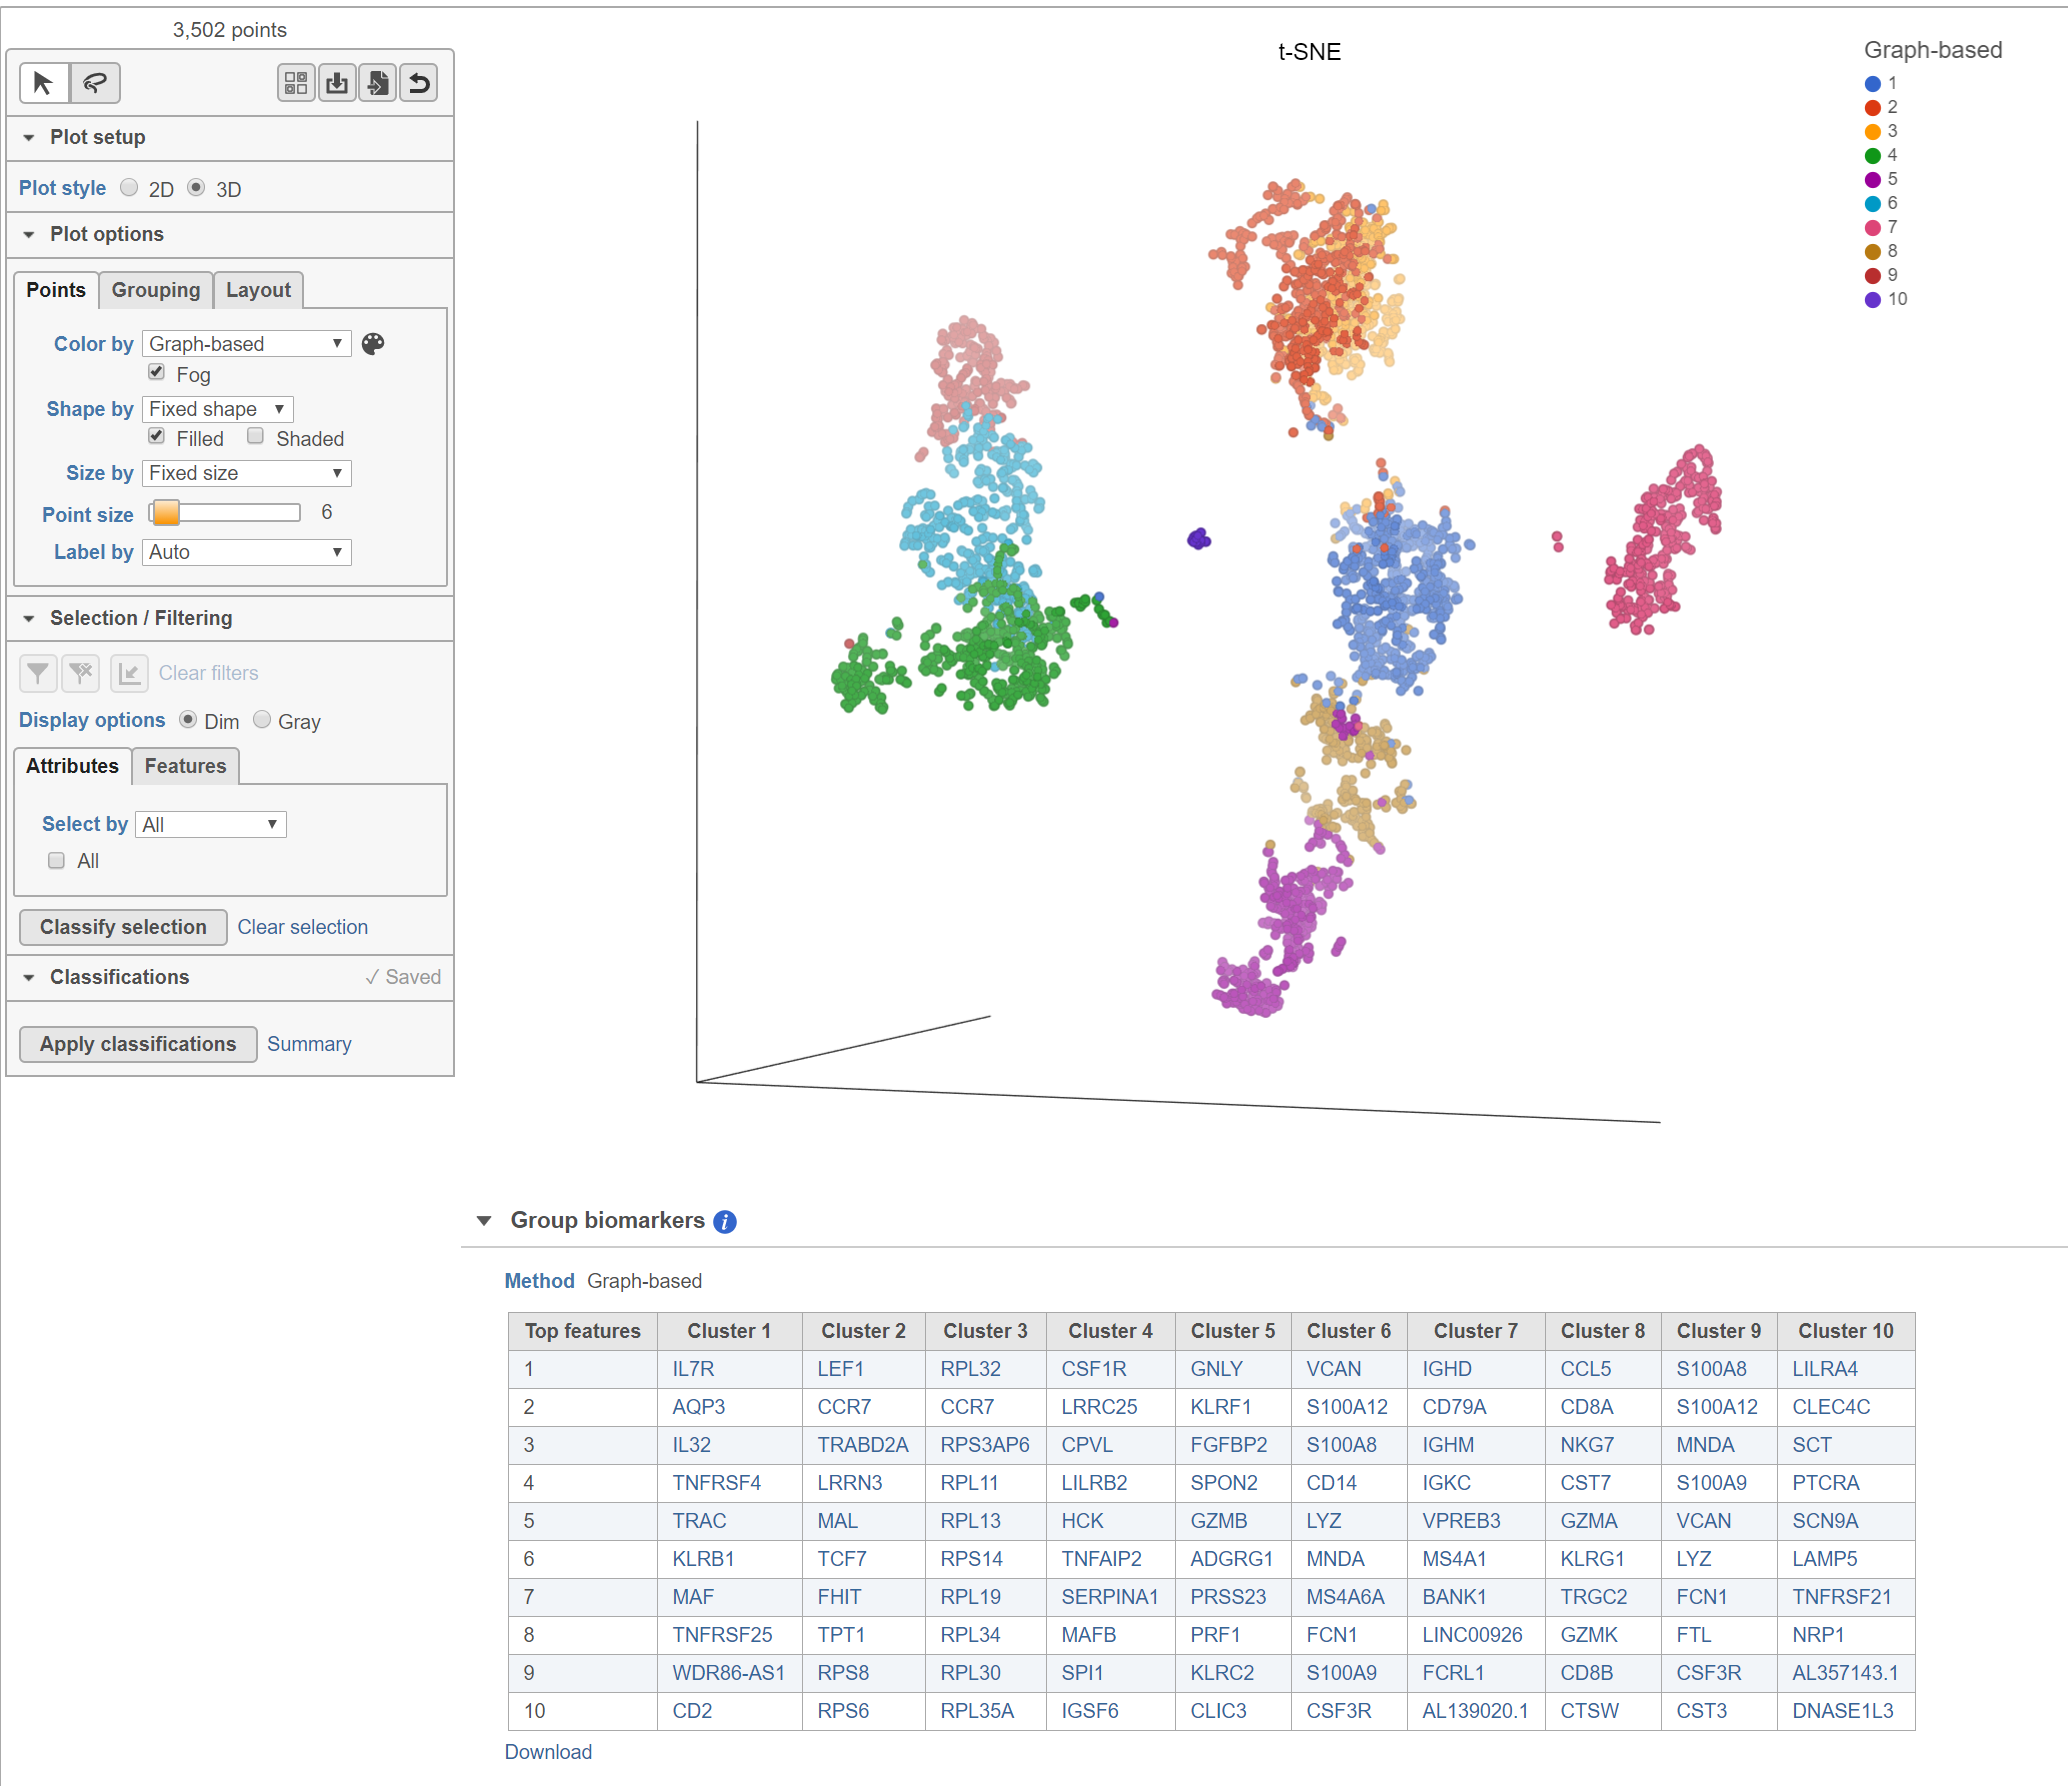
Biomarkers for each cluster are calculated using an ANVOA test where each cluster is compared to the other cells in the data set, genes with fold-change > 1.5 are included, and these genes are sorted by ascending p-value (ties broken by greater fold change). The top 10 genes for each cluster are shown in the table. The full ANOVA results can be obtained by clicking the Run ANOVA button, which will generate a Feature list data node.
The Clustering result data node includes the input values for each gene and adds cluster assignment as a new attribute, Graph-based, for each observation. If the Clustering result data node is visualized by Scatter plot, PCA, t-SNE, or UMAP, the plot will be colored by the Graph-based attribute and the group biomarker table, if generated, will be included below the plot (Figure 2).
| Numbered figure captions | ||||
|---|---|---|---|---|
| ||||
|
Basic Graph-based clustering parameters
...
To increase the number of clusters, increase the resolution (Figure 23). To decrease the number of clusters, decrease the resolution. Default is 1.
...
Clustering preserves the local structure of the data by focusing on the distances between each point and its k nearest neighbors. The optimal perplexity depends on the size and density of the data. Generally, a larger and/or more dense data set will benefit from a larger number of nearest neighbors. Increasing the number of nearest neighbors will increase the size of clusters and vice versa (Figure 34). Default is 30. The range of possible values is 3 to 100.
...
Overview
Content Tools