Page History
...
the principal components analysis (PCA) scatter plot allows us to visualize similarities and differences between the samples in a data set.
- Select the Click the Gene Counts data node
- Select Visualizations from the task Click Exploratory analysis in the task menu
- Select PCA from the Visualizations section of the task menu
- Select Click PCA
- Click Finish to run PCA with the default options
...
| Numbered figure captions | ||||
|---|---|---|---|---|
| ||||
|
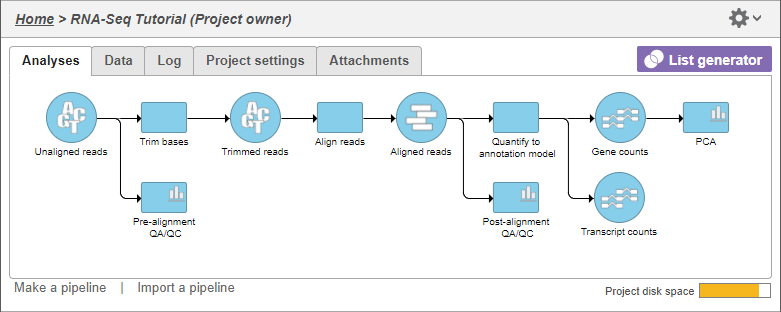

- Double click the PCA task node to open the PCA scatter plot (Figure 2)
...
Overview
Content Tools