Page History
...
- Click Glioma
- Click the arrow to move it to the top-right panel
- Click Oligodendrocytes
- Click the arrow to move it to the top-right bottom-right panel
- Click Add comparison (Figure 87)
This will set up fold calculations with glioma as the numerator and oligodendrocytes as the denominator.
...
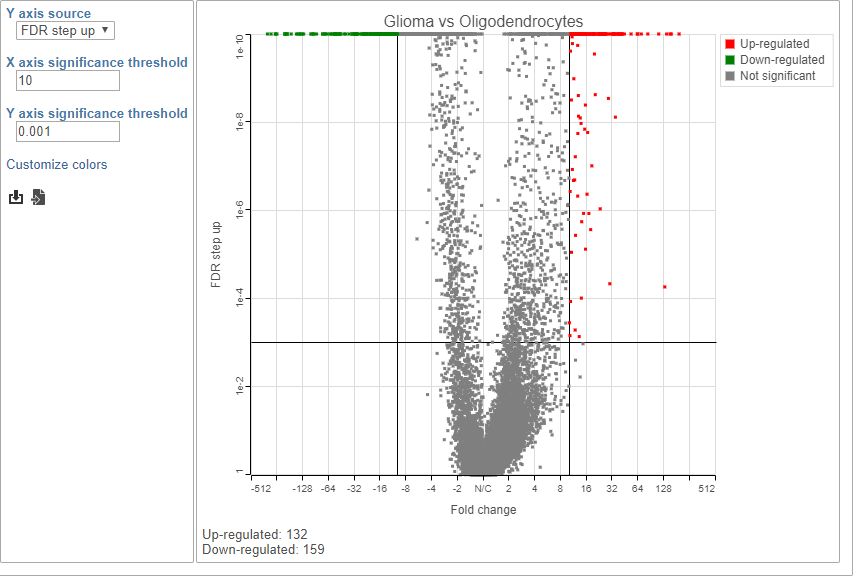
This gives 132 up-regulated and 159 down-regulated genes (Figure 98).
| Numbered figure captions | ||||
|---|---|---|---|---|
| ||||
|
...
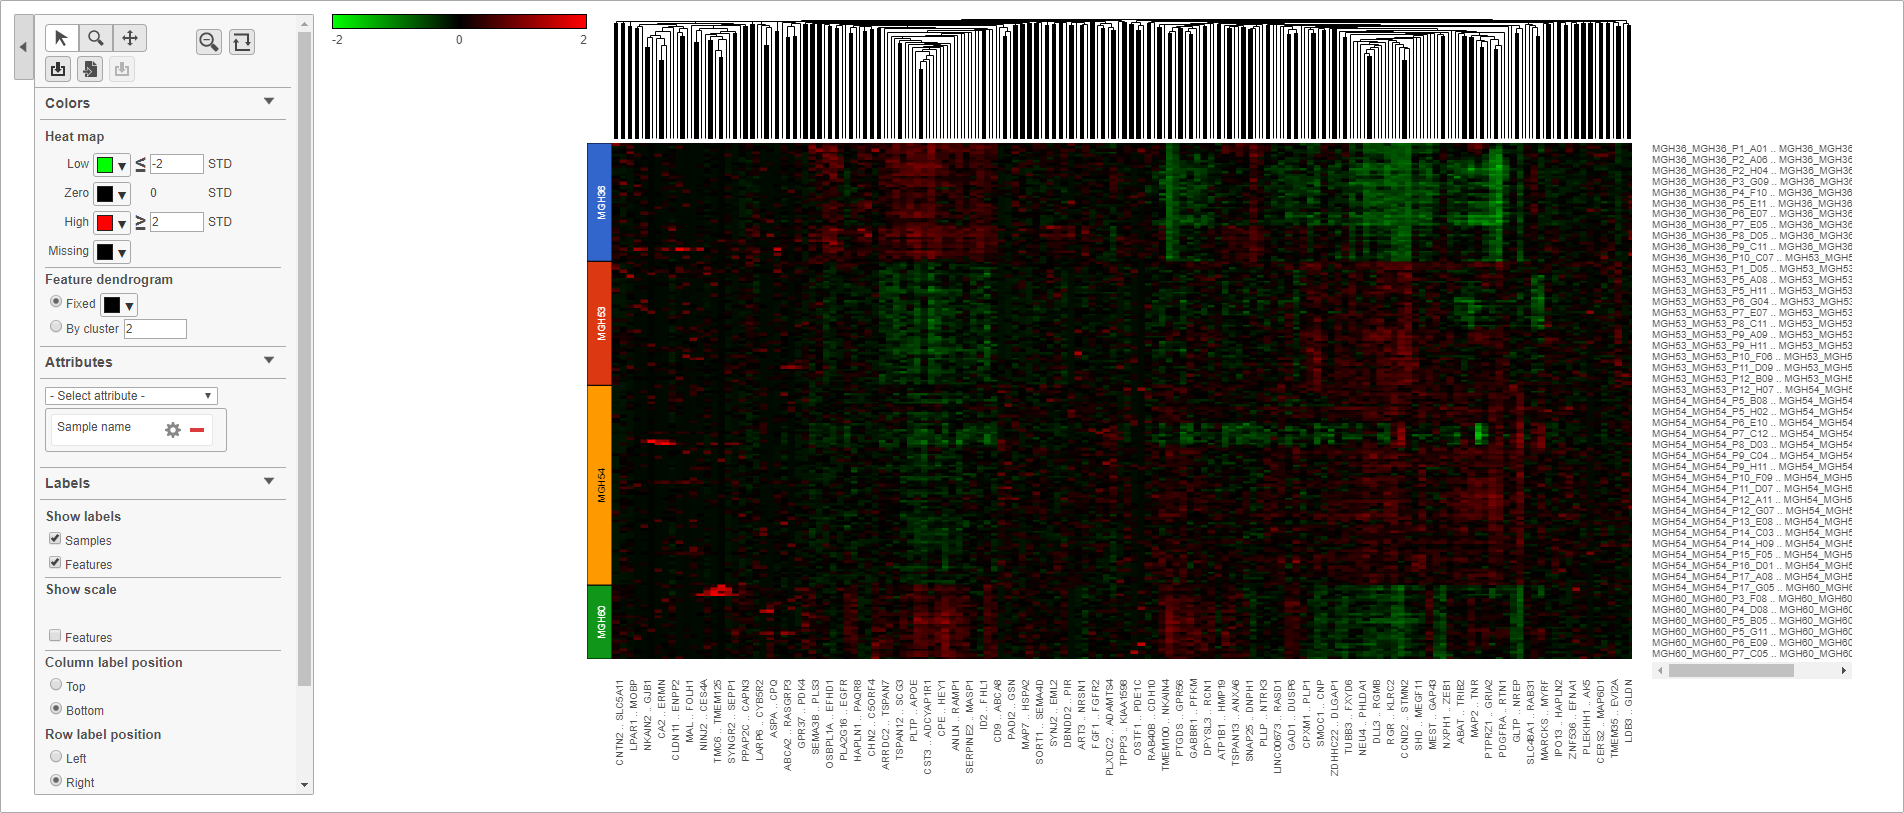
Using the hierarchical clustering options we can choose to include only cells from certain samples. We can also choose the order of cells on the heat map instead of clustering. Here, we will include only glioma cells and order the samples by sample ID name (Figure 109).
- Uncheck Cluster samples
- Click Filtering and set the filter to include Classifications is Glioma
- Choose Sample name from the Sample order drop-down menu in the Ordering section
- Click Finish
...
Cells are now labeled with their sample name. Interestingly, samples show characteristic patterns of expression (Figure 1110).
| Numbered figure captions | ||||
|---|---|---|---|---|
| ||||
|
...
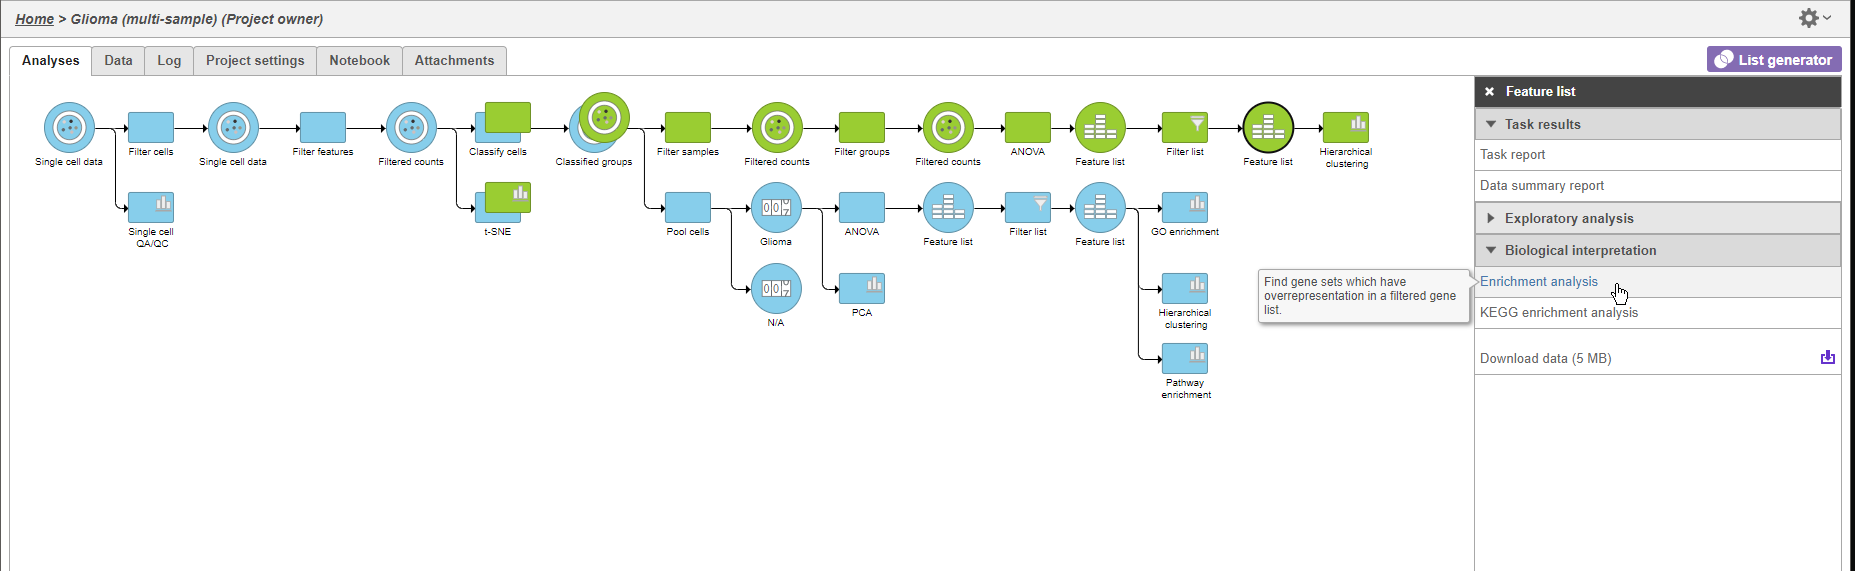
- Click the second green Feature list node
- Click Biological interpretation in the task menu
- Click Enrichment anlaysis (Figure 1211)
| Numbered figure captions | ||||
|---|---|---|---|---|
| ||||
|
...
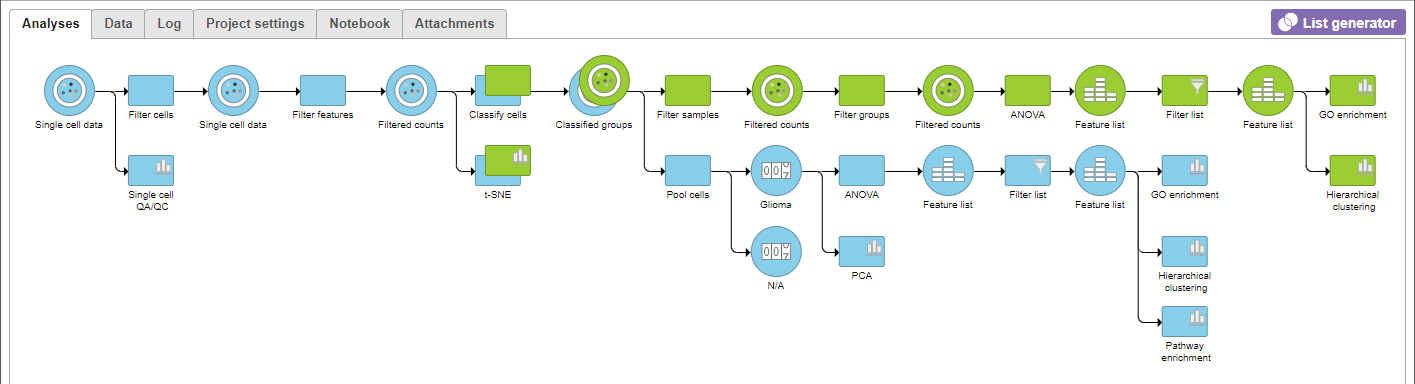
A GO enrichment node will be added to the pipeline view (Figure 1312).
| Numbered figure captions | ||||
|---|---|---|---|---|
| ||||
|
...
Top GO terms in the enrichment report include "myelin sheath", "ensheathment of neurons", and "axon ensheathment" (Figure 1413), which corresponds well with the role of oligodendrocytes in creating the myelin sheath that supports and protect axons in the central nervous system.
...
Overview
Content Tools