Page History
...
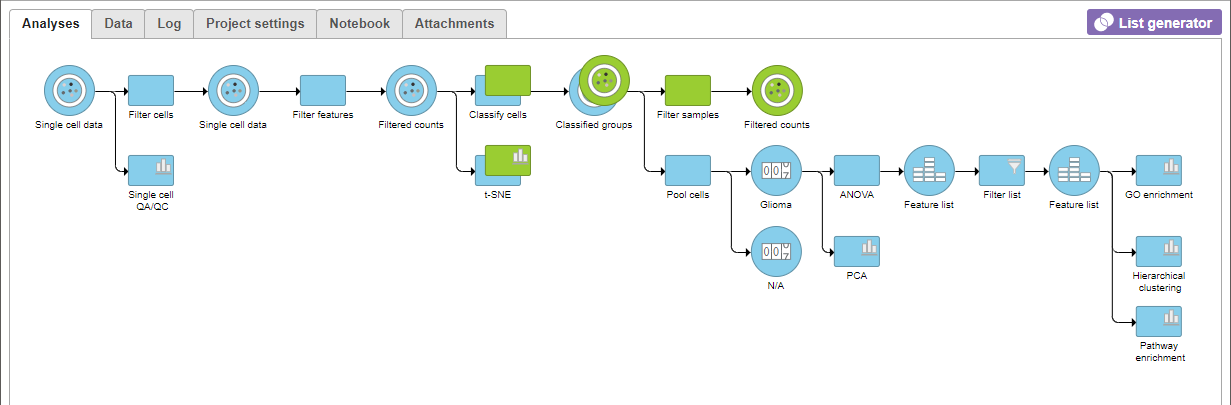
Differential expression analysis can be used to compare cell types. Here, we will compare glioma and oligodendrocyte cells to identify genes differentially regulated in glioma cells from the Oligodendroglioma subtype. This comparison is of interest because glioma cells in Oligodendroglioma are thought to originate from oligodendrocytes.
...
Filter samples
To analyze only the Oligodendroglioma subtype, we can filter the samples.
...
A Filtered Counts data node will be created with only cells that are from Oligodendroglioma samples (Figure 3).
| Numbered figure captions | ||||
|---|---|---|---|---|
| ||||
|
...
Filter groups
Because we are only interested in analyzing glioma and oligodendrocyte cells, we will filter out microglia cells using the groups filer.
...
A Filtered Counts data node will be created with only glioma and oligodendrocyte cells from the Oligodendroglioma samples. The Filtered groups task must complete before we can proceed to identifying differentially expressed genes.
...
Identify differentially expressed genes
- Click the second green Filtered counts data node
- Click Differential analysis in the task menu
- Click ANOVA (Figure 5)
...
- Click
 to apply the filter and generate a filtered Feature list node
Exploring differentially expressed genes
To visualize the results, we can generate a hierarchical clustering heat map.
...
Overview
Content Tools