Page History
...
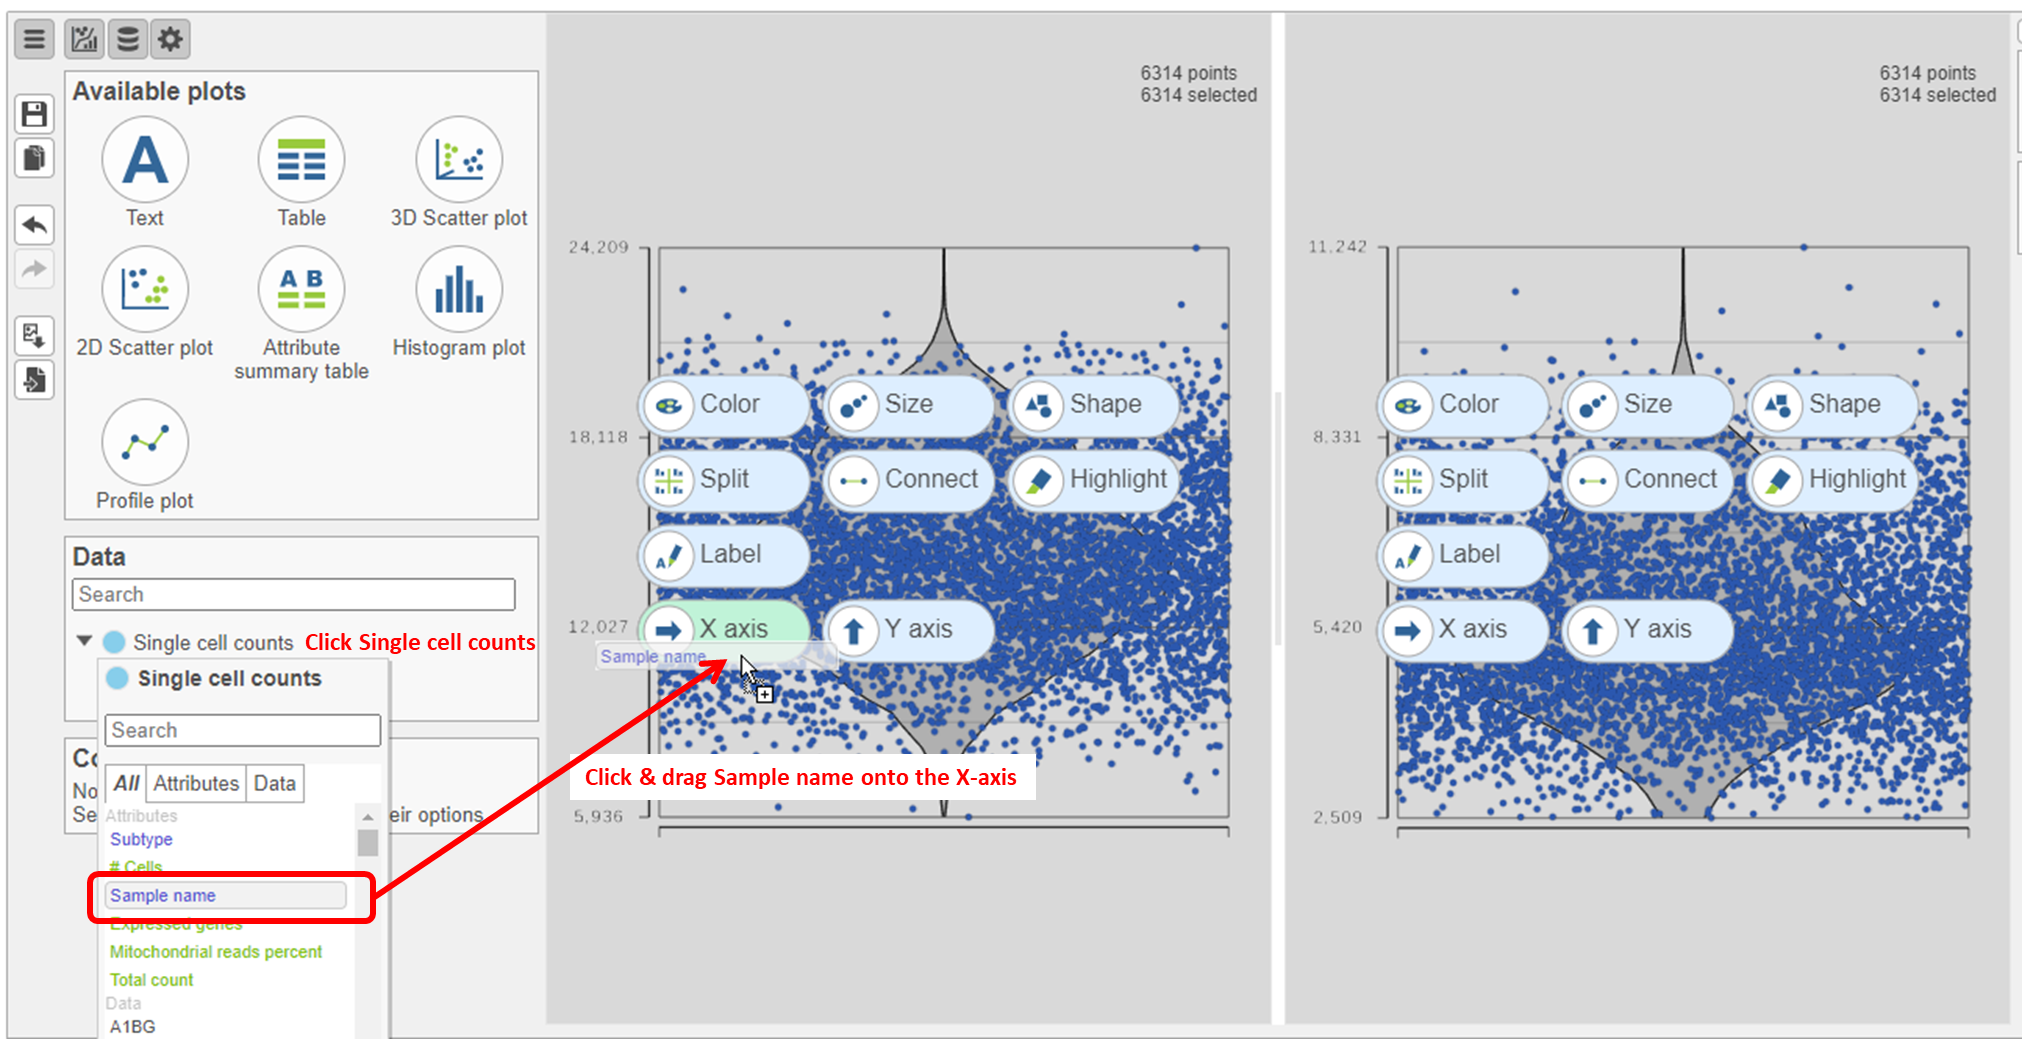
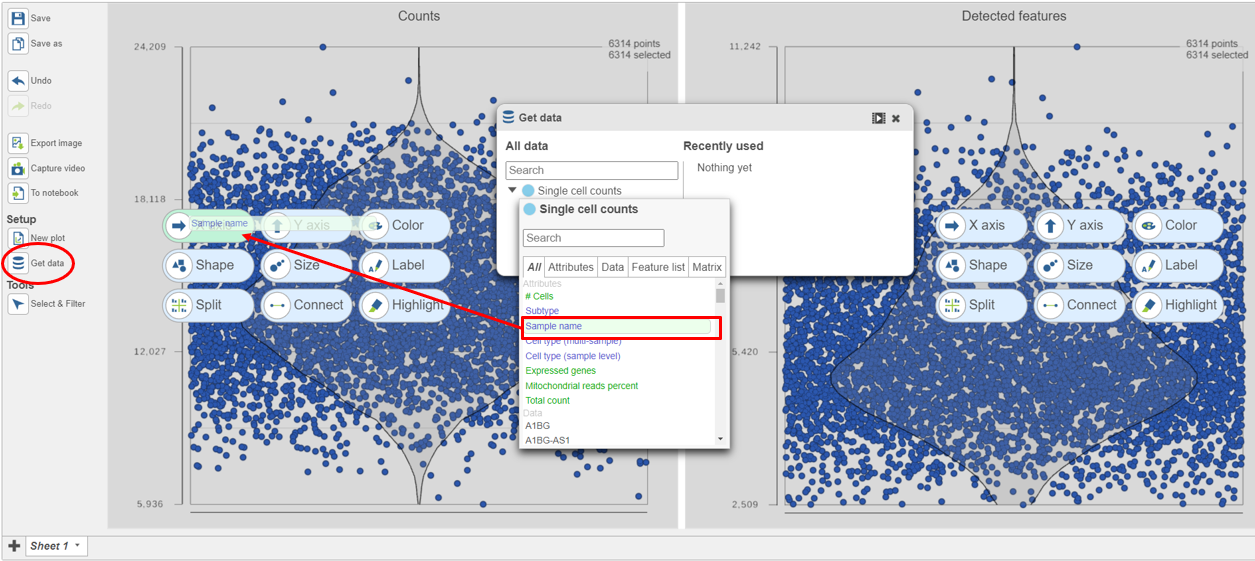
- Click on Single cell counts in the Get Data card on icon on the left (Figure 9)
- Click and drag the Sample name attribute onto the Counts plot and drop it onto the X-axis
- Repeat this for the Detected genes plot
...
| Numbered figure captions | ||||
|---|---|---|---|---|
| ||||
|
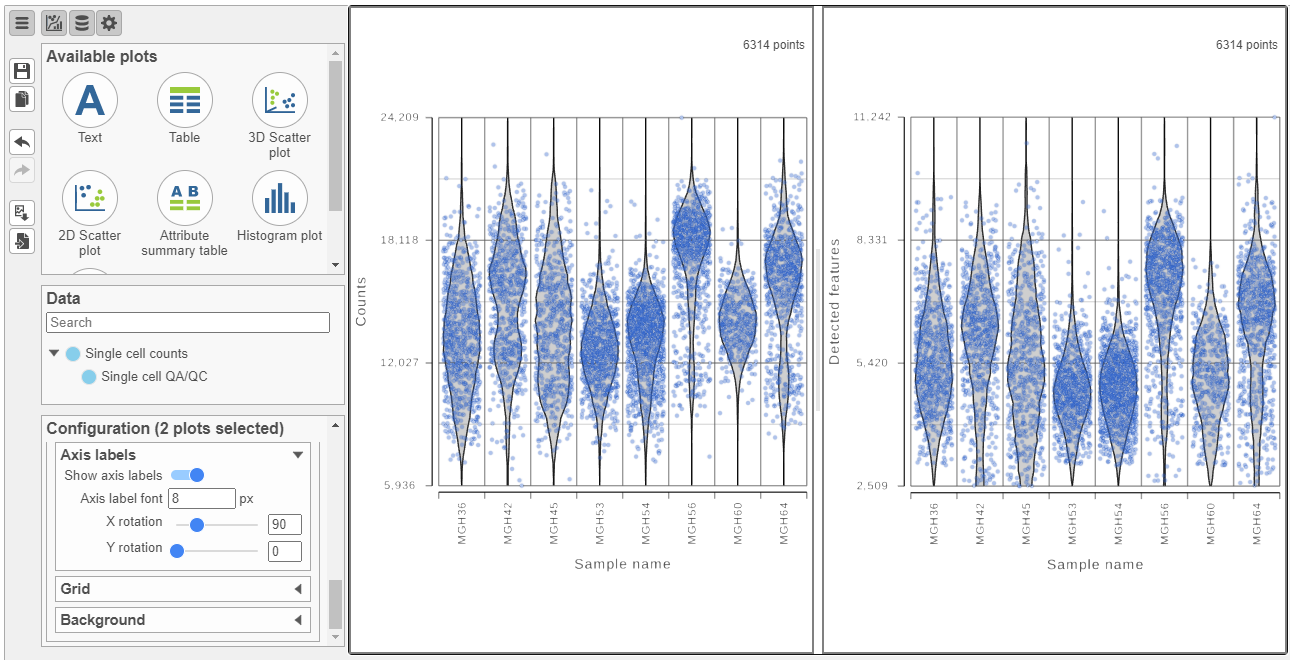
The cells are now separated into different samples along the x-axis (Figure 10)
- Hold Control and left-click to select both plots
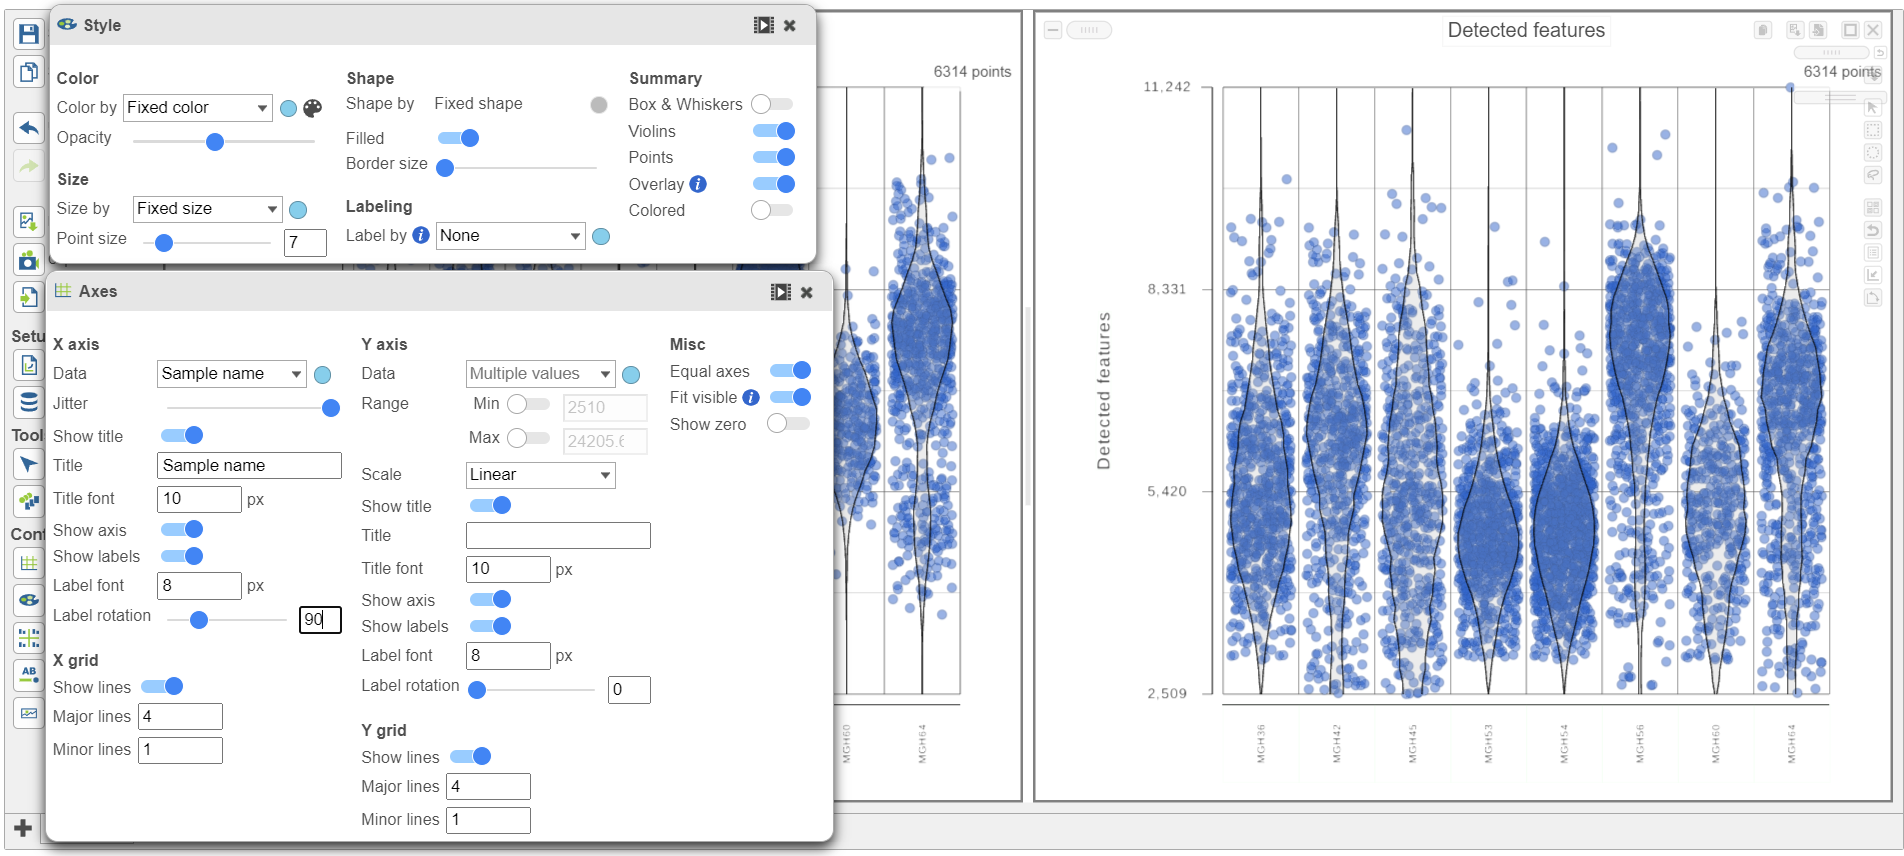
- In Open the Configuration card Style icon on the left , scroll down and expand the Color cardUse the under Configure
- Under Color, use the slider to reduce the Opacity
- In the Configuration card on the left, scroll down and expand the Axis label cardOpen the Axis icon on the left
- Adjust the X-rotation on the plots to 90
...
| Numbered figure captions | ||||
|---|---|---|---|---|
| ||||
| ||||
|
Note how both plots were modified at the same time.
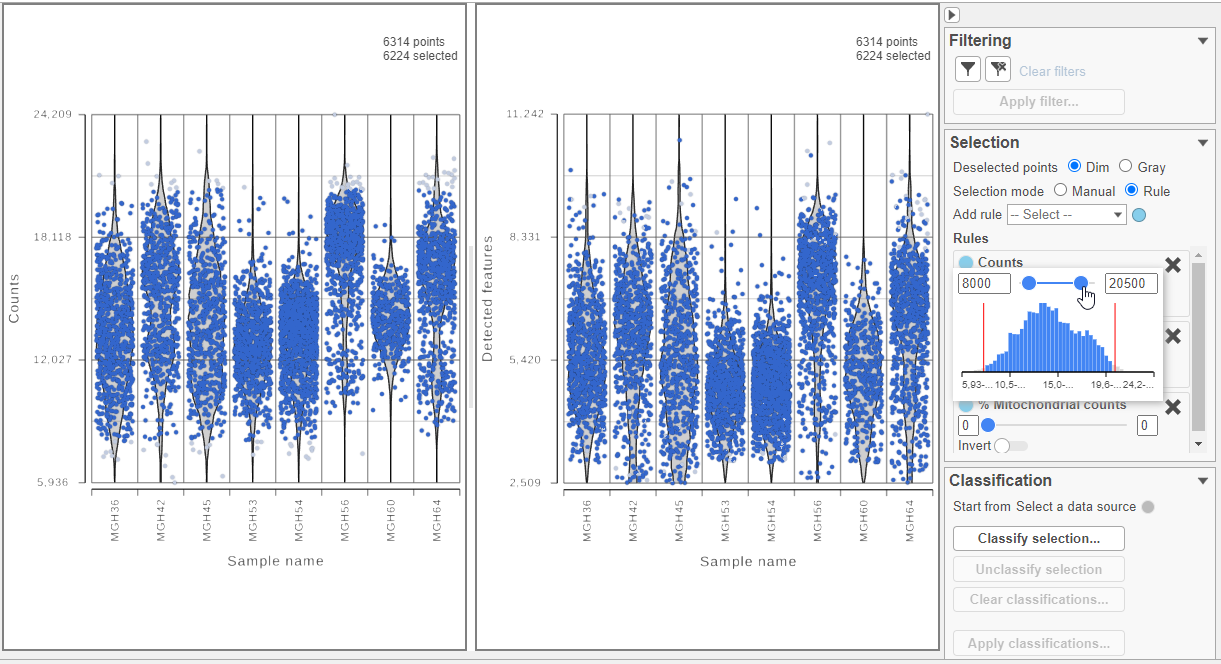
Cells can be selected by setting thresholds in the Selection card on the rightusing the Select & Filter tool. Here, we will select cells based on the total count
- Open Select & Filter under Tools on the left
- Under Criteria, Click Pin histogram to see the distribution of counts
- Set the Counts thresholds to 8000 and 20500
...
| Numbered figure captions | ||||
|---|---|---|---|---|
| ||||
|
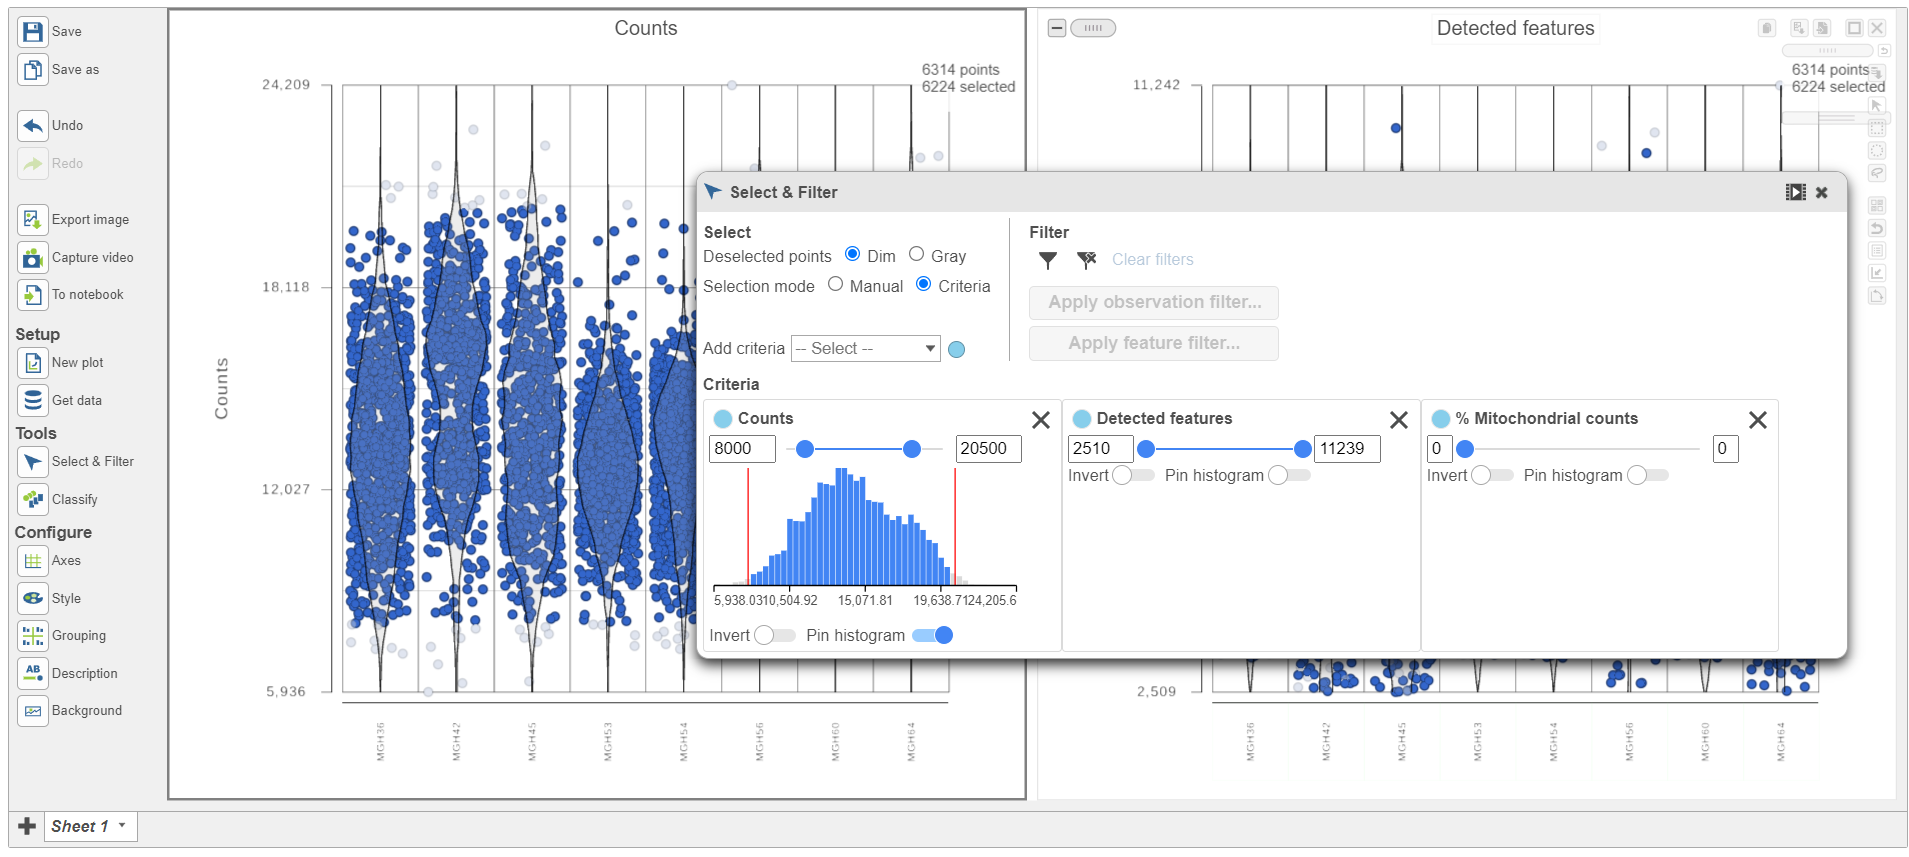
Because this data set was already filtered by the study authors to include only high-quality cells, this count filter is sufficient.
- Click
 in the Filtering card on the rightunder Filter to include the selected cells
 - Click Apply observation filter
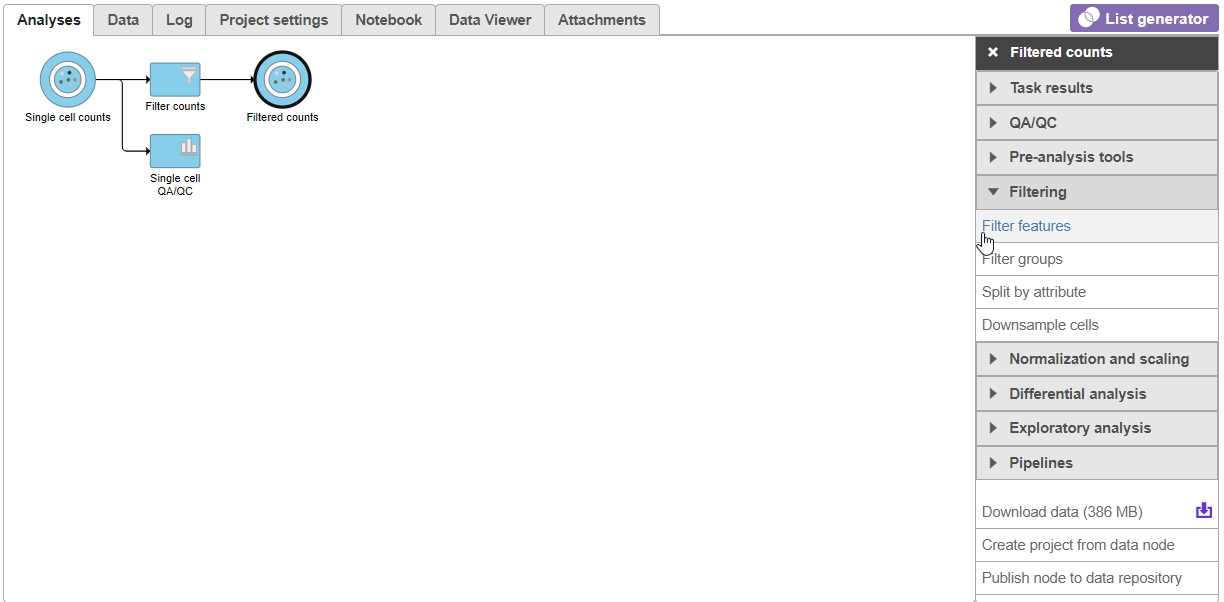
- Click the Single cell counts data node in the pipeline preview (Figure 12)
- Click Select
...
| Numbered figure captions | ||||
|---|---|---|---|---|
| ||||
|
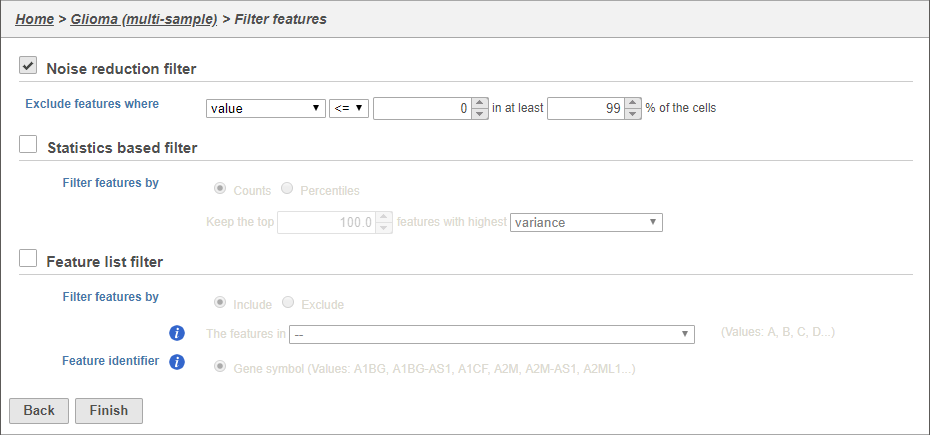
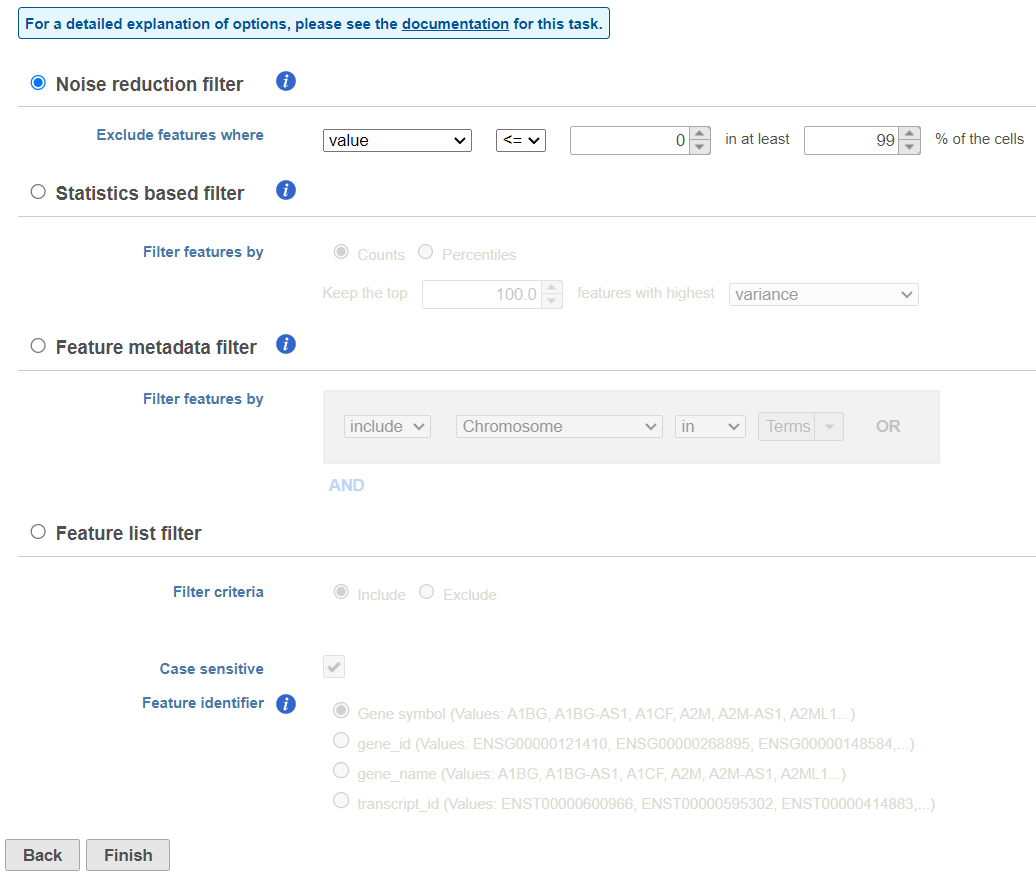
There are three four categories of filter available - noise reduction, statistics based, feature metadata, and feature list (Figure 15).
...
| Numbered figure captions | ||||
|---|---|---|---|---|
| ||||
|
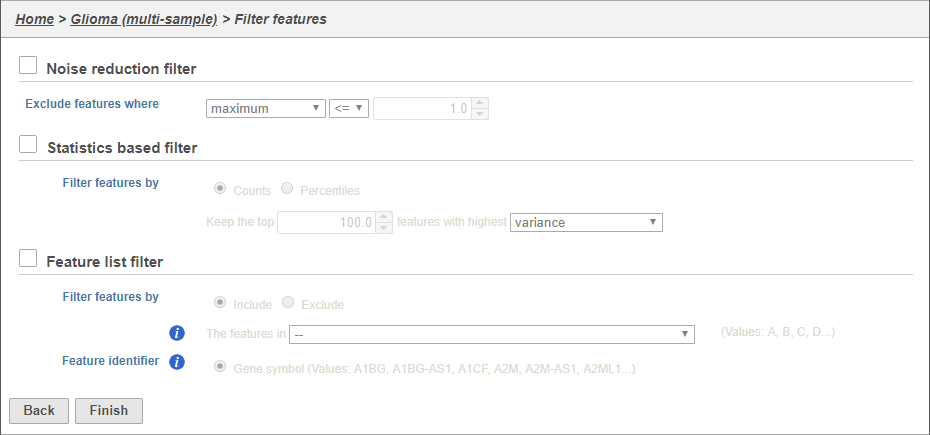
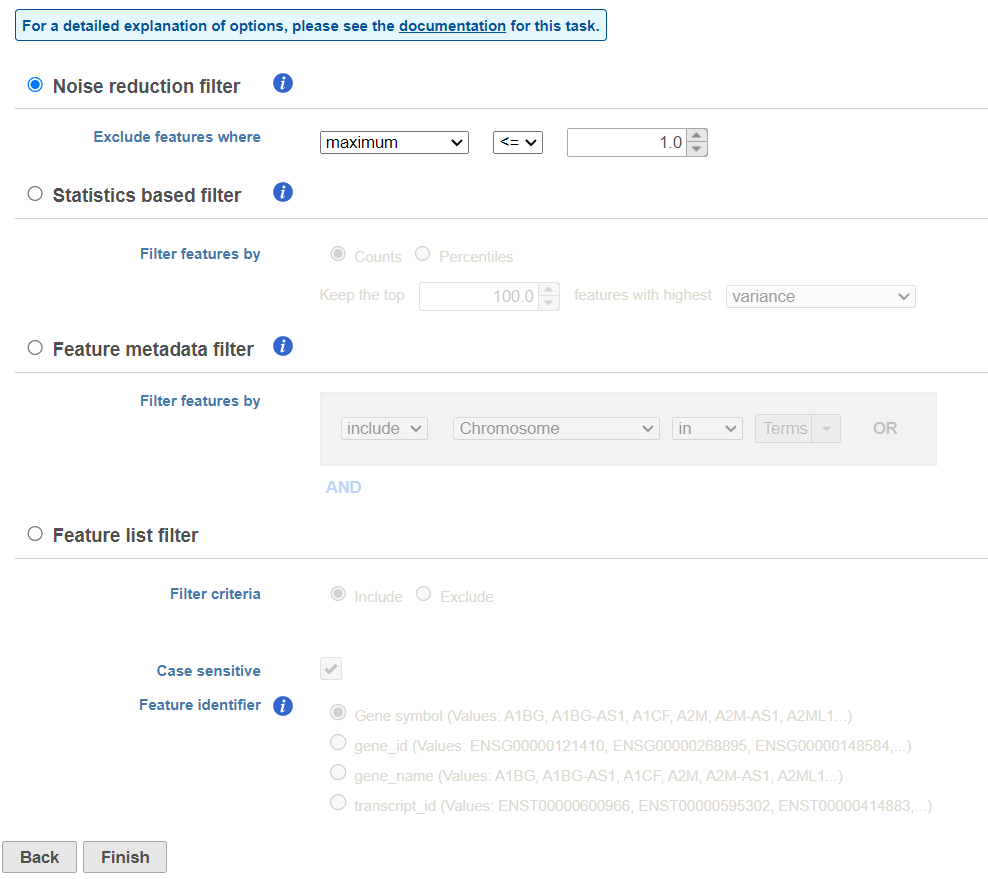
The noise reduction filter allows you to exclude genes considered background noise based on a variety of criteria. The statistics based filter is useful for focusing on a certain number or percentile of genes based on a variety of metrics, such as variance. The feature list filter allows you to filter your data set to include or exclude particular genes.
...
| Numbered figure captions | ||||
|---|---|---|---|---|
| ||||
|
This produces a Filtered counts data node. This will be the starting point for the next stage of analysis - identifying cell types in the data using the interactive t-SNE plot.
...
Overview
Content Tools