Join us for a webinar: The complexities of spatial multiomics unraveled
May 2
Page History
...
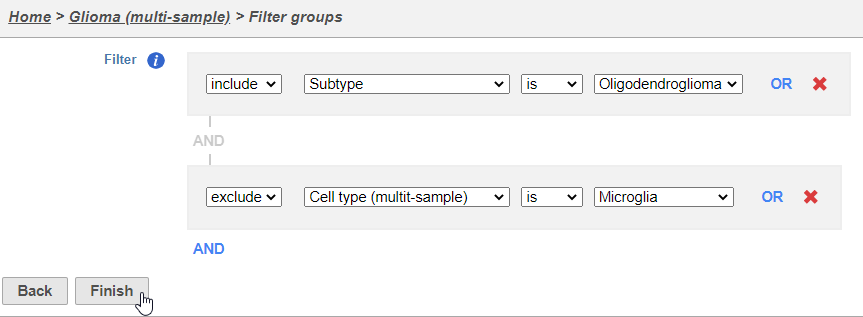
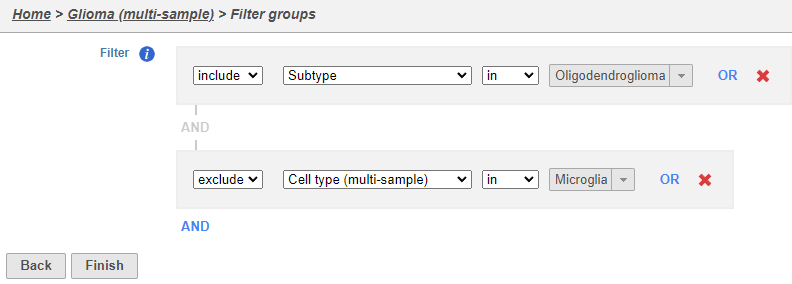
- Set the filter to Include samples where Subtype is Oligodendroglioma
- Click AND
- Set the second filter to exclude Cell type (Multimulti-sample) is Microglia
- Click Finish to apply the filter (Figure 2)
...
| Numbered figure captions | ||||
|---|---|---|---|---|
| ||||
|
A Filtered counts data node will be created with only cells that are from oligodendroglioma samples (Figure 3).
...
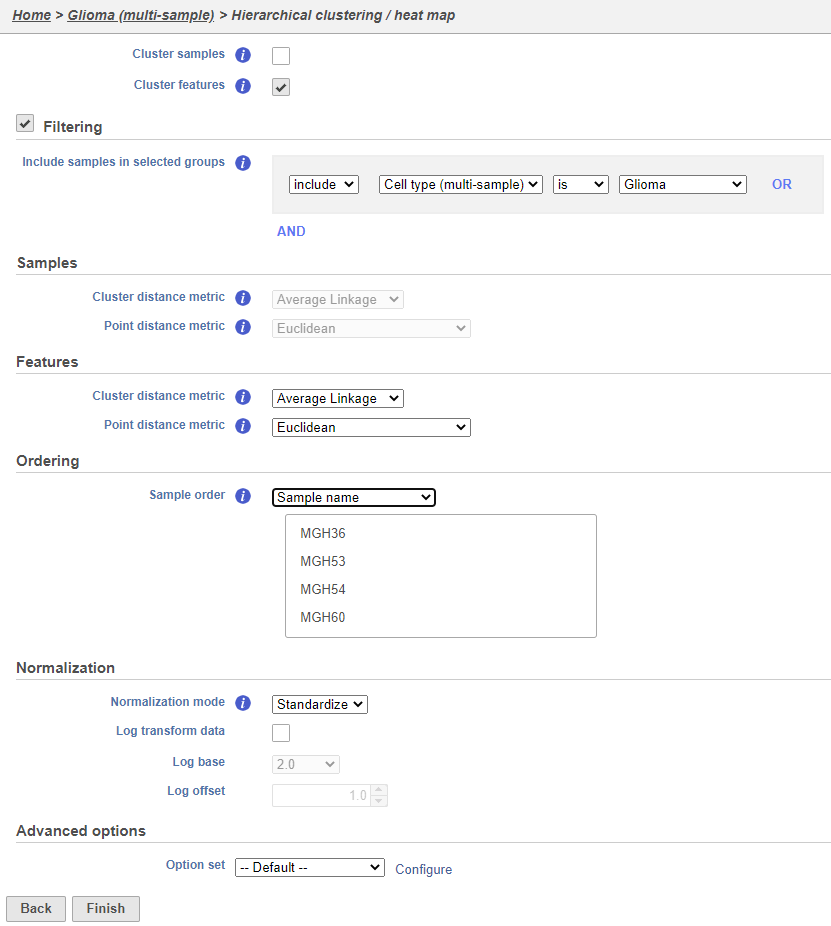
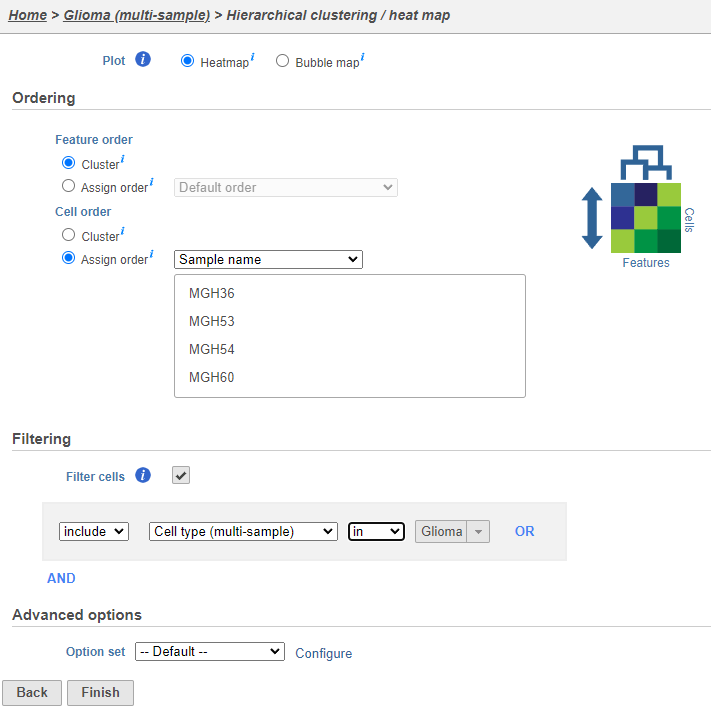
Using the hierarchical clustering options we can choose to include only cells from certain samples. We can also choose the order of cells on the heatmap instead of clustering. Here, we will include only glioma cells and order the samples by sample name (Figure 7).
- Make sure Cluster samples is unchecked for Cell order
- Click Filtering and Filter cells under Filtering and set the filter to include Cell type (multi-sample) is Glioma
- Choose Sample name from the Sample orderthe Cell order drop-down menu in the Ordering Assign order section
- Click Finish
| Numbered figure captions | ||||
|---|---|---|---|---|
| ||||
|
- Double click the green Hierarchical clustering node to open the heatmap
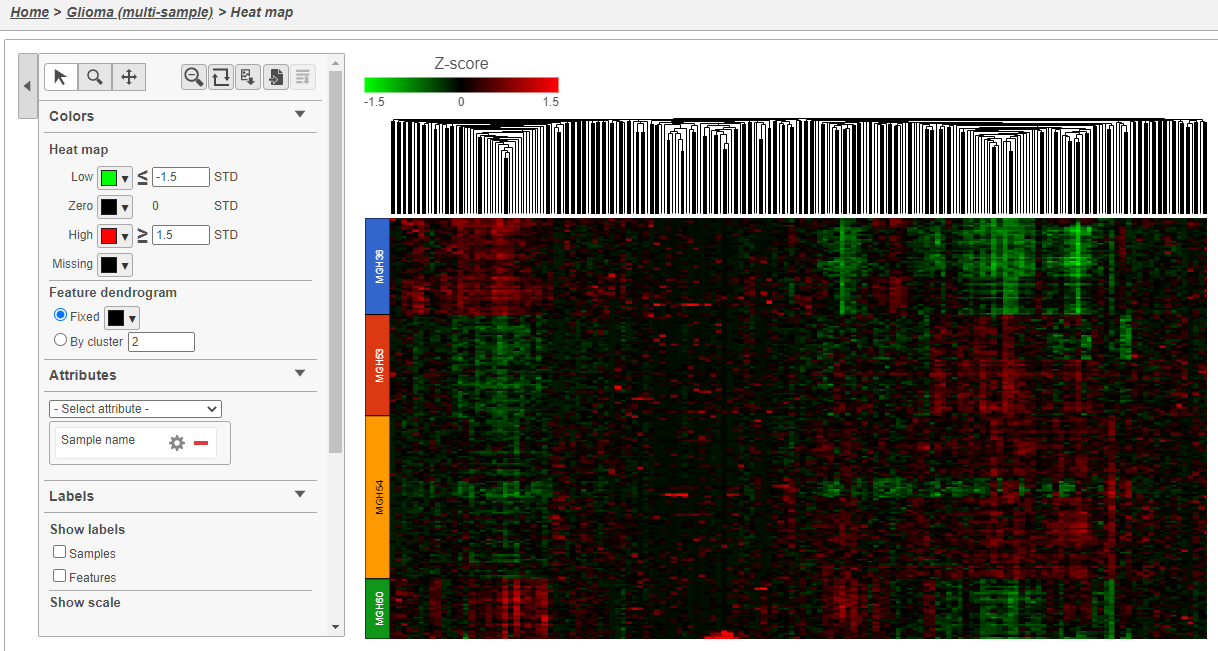
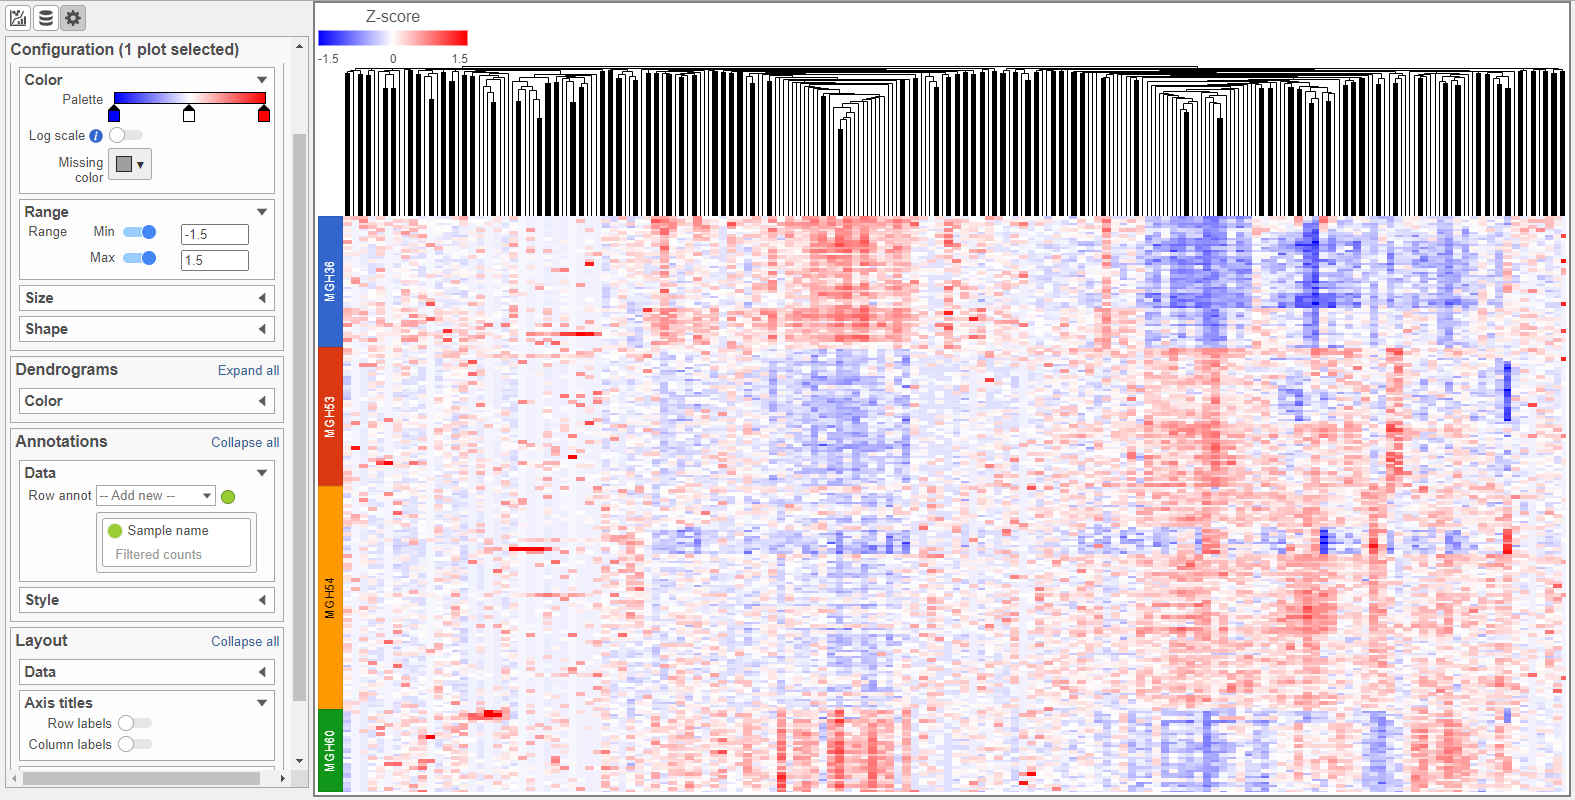
The heatmap will appear black differences may be hard to distinguish at first; the range from red to green blue with a black white midpoint is set very wide because of a few outlier cells. We can adjust the range to make more subtle differences visible. We can also adjust the color.
- Set Low Set the Range toggle Min to -1.5
- Press Enter
- Set High Set the Range toggle Max to 1.5
- Press Enter
The heatmap now shows clear patterns of red and greenblue.
- Click Samples and Features in the Show labels section of the panel to deselect them and Click Axis titles and deselect the Row labels and Column labels of the panel to hide sample and feature names, respectively.
- Select Sample name from the Attributes Annotations drop-down menu
Cells are now labeled with their sample name. Interestingly, samples show characteristic patterns of expression for these genes (Figure 8).
...
| Numbered figure captions | ||||
|---|---|---|---|---|
| ||||
|
- Click Glioma (multi-sample) to return to the Analyses tab.
...
Overview
Content Tools