Join us for a webinar: The complexities of spatial multiomics unraveled
May 2
Page History
...
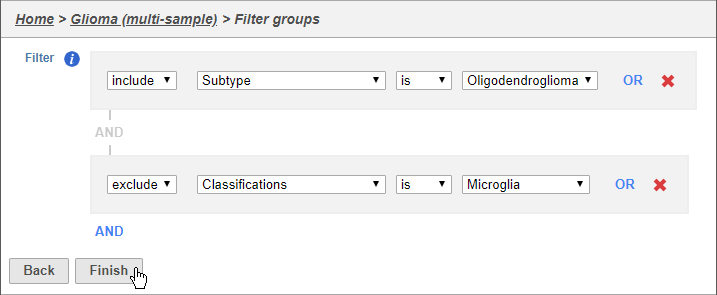
- Set the filter to Include samples where Subtype is Oligodendroglioma
- Click AND
- Set the second filter to exclude Classifications is Microglia
- Click Finish to apply the filter (Figure 2)
...
| Numbered figure captions | ||||
|---|---|---|---|---|
| ||||
|
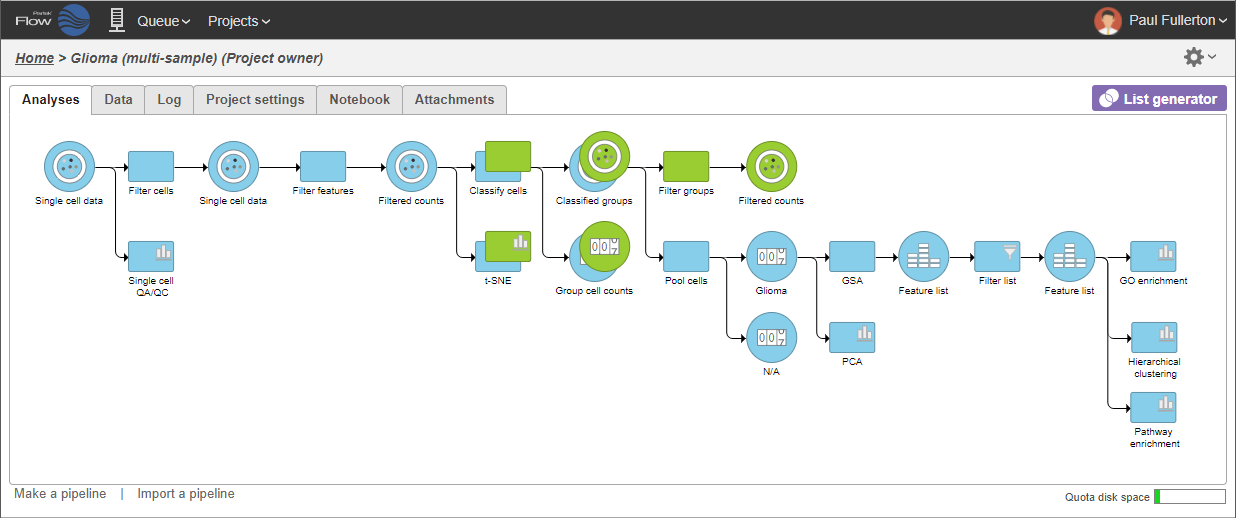
A Filtered counts data node will be created with only cells that are from oligodendroglioma samples (Figure 3).
| Numbered figure captions | ||||
|---|---|---|---|---|
| ||||
|
Identify differentially expressed genes
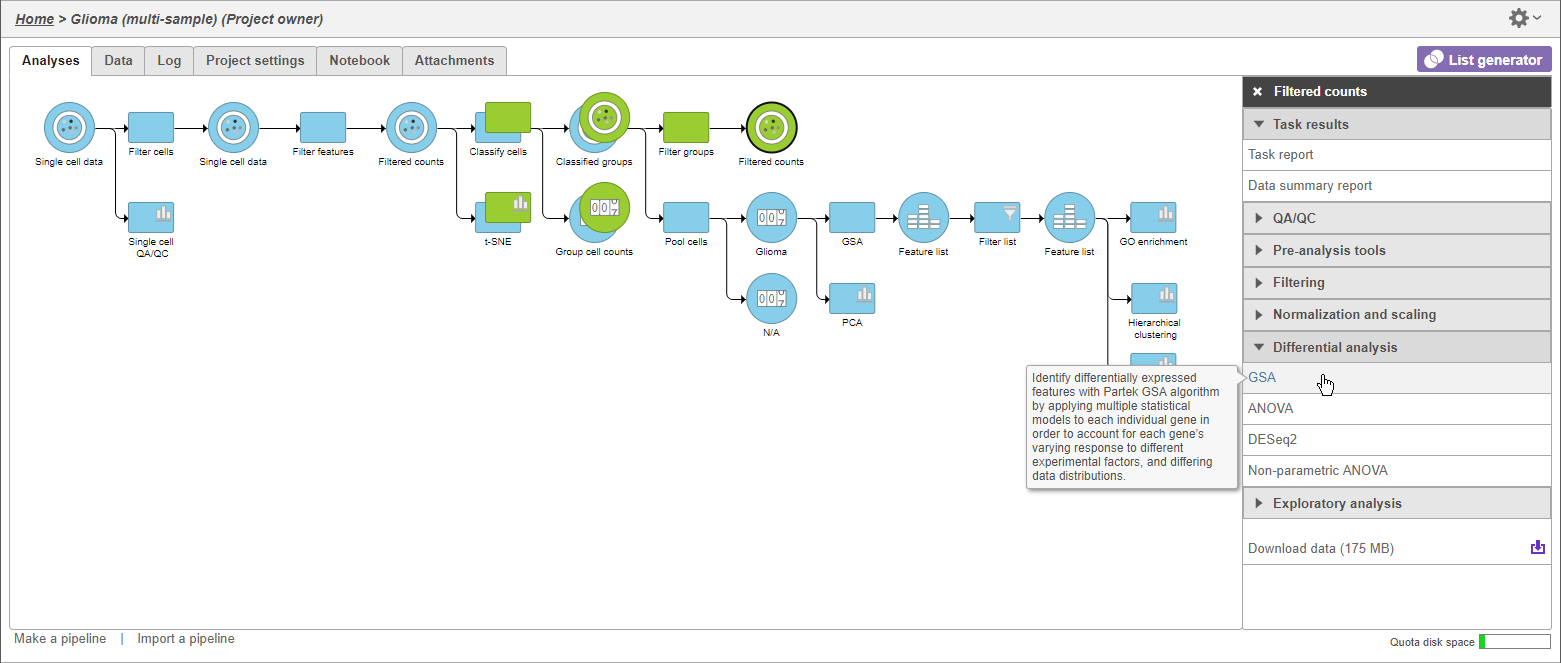
- Click the green Filtered counts data node
- Click Differential analysis in the task menu
- Click GSA (Figure 5)
| Numbered figure captions | ||||
|---|---|---|---|---|
| ||||
|
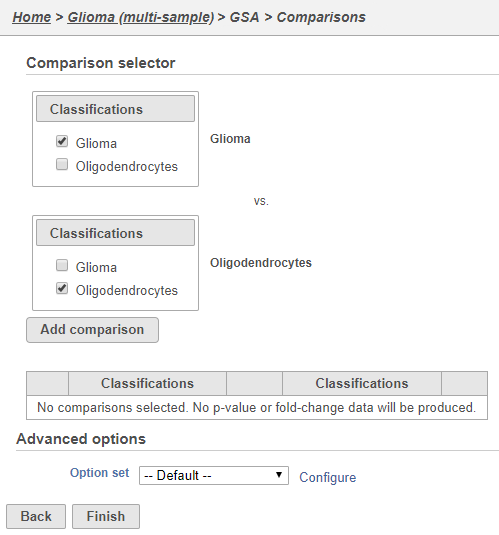
The configuration options (Figure 6) includes sample and cell-level attributes. Here, we want to compare different cell types so we will include Classifications.
...
This will set up fold calculations with glioma as the numerator and oligodendrocytes as the denominator.
| Numbered figure captions | ||||
|---|---|---|---|---|
| ||||
|
...
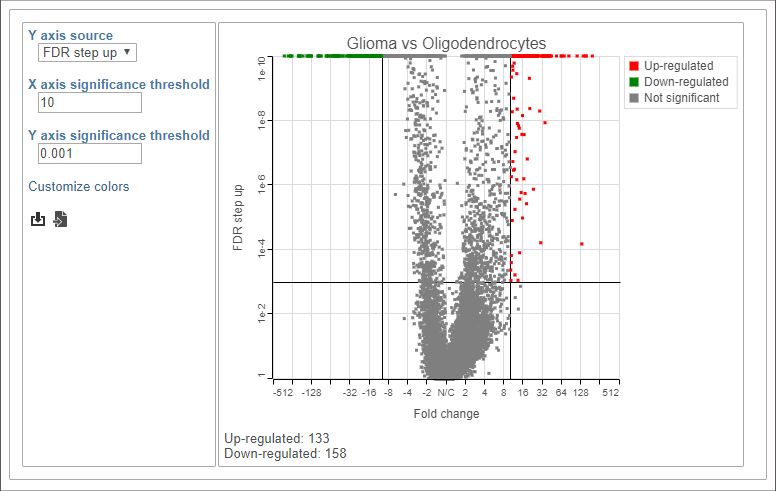
This gives 133 up-regulated and 158 down-regulated genes (Figure 8).
| Numbered figure captions | ||||
|---|---|---|---|---|
| ||||
|
...
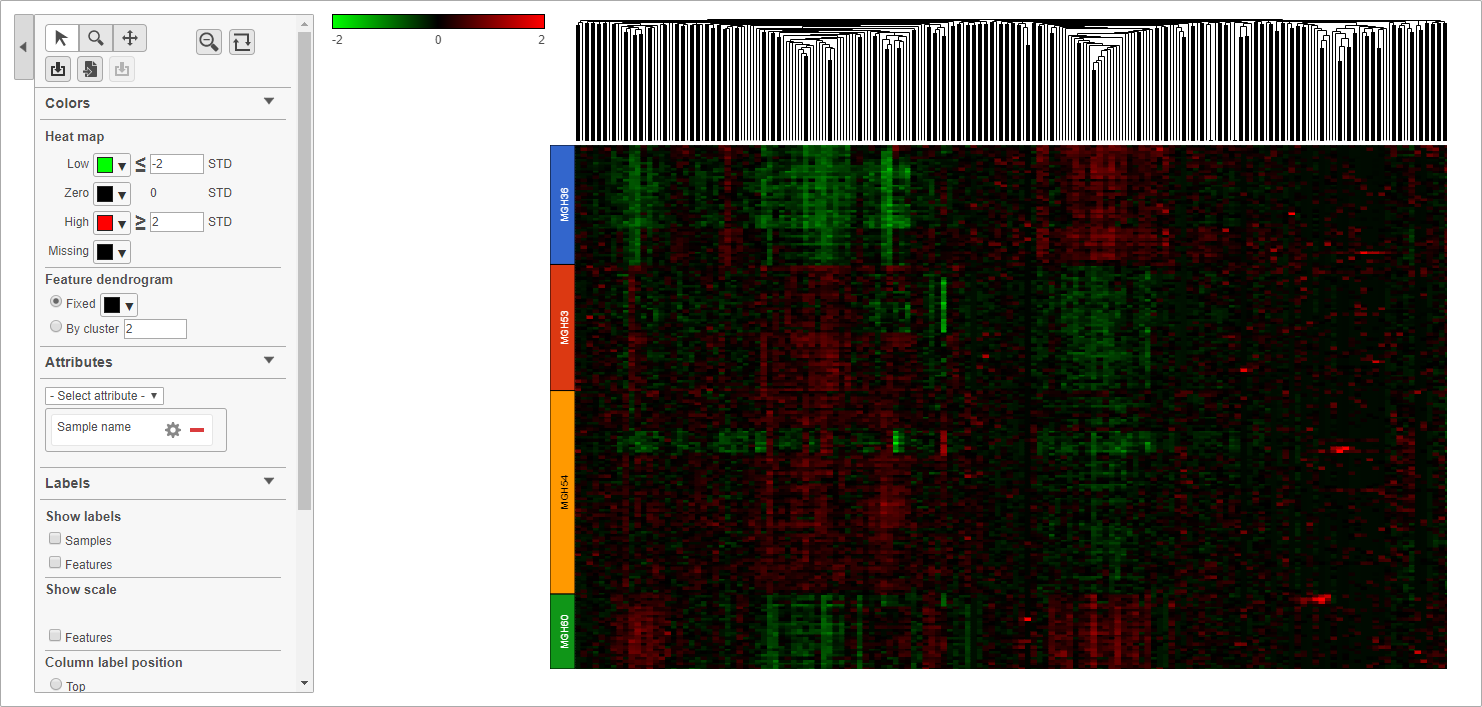
Cells are now labeled with their sample name. Interestingly, samples show characteristic patterns of expression for these genes (Figure 10).
| Numbered figure captions | ||||
|---|---|---|---|---|
| ||||
|
...
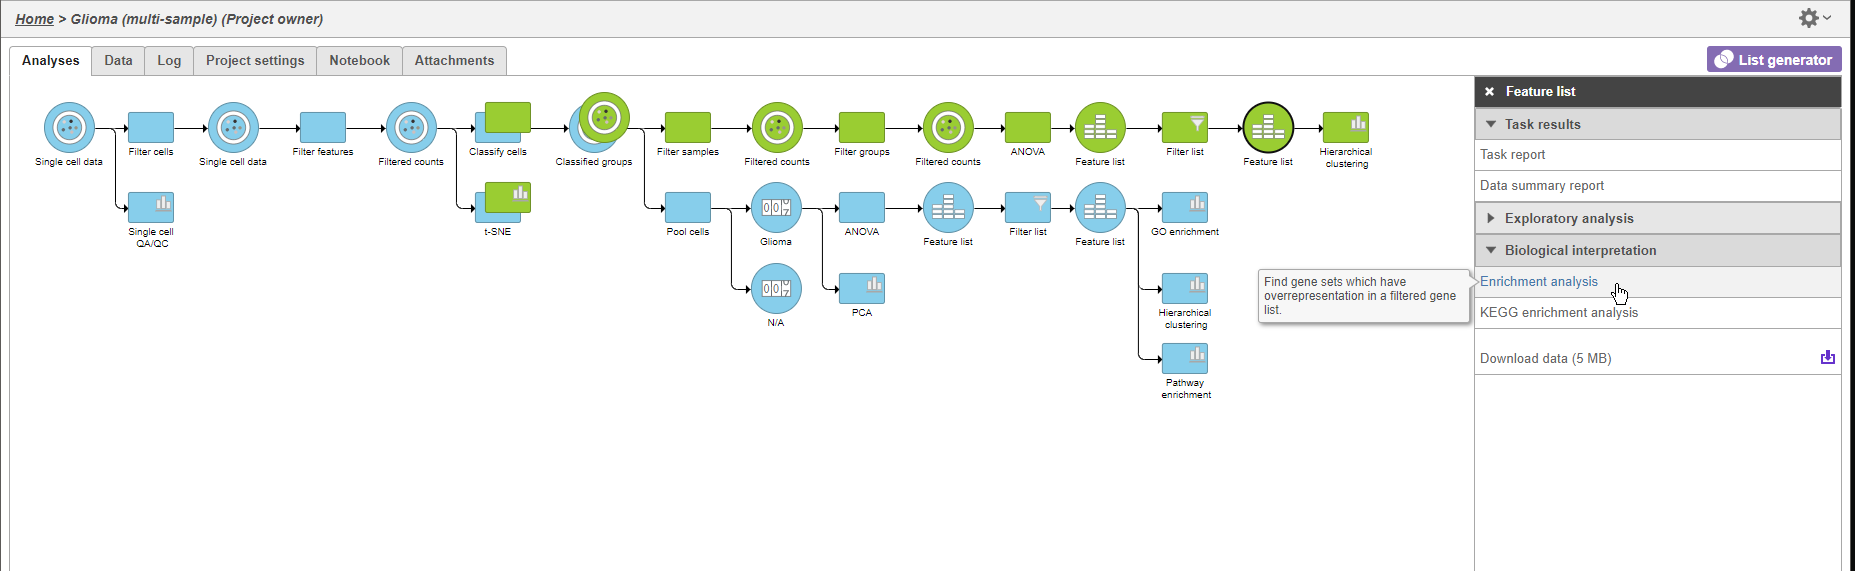
- Click the second green Feature list node
- Click Biological interpretation in the task menu
- Click Enrichment analysis (Figure 11)
| Numbered figure captions | ||||
|---|---|---|---|---|
| ||||
|
- Choose Homo sapiens (human) - hg38 from the Assembly drop-down menu
- Select Finish to continue with the most recent gene set
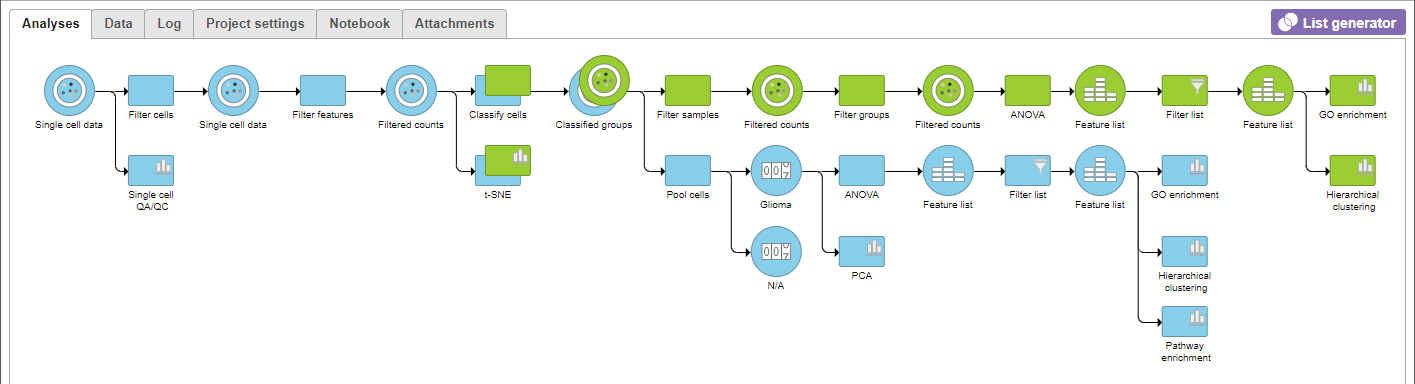
A GO enrichment node will be added to the pipeline view (Figure 12).
| Numbered figure captions | ||||
|---|---|---|---|---|
| ||||
|
...
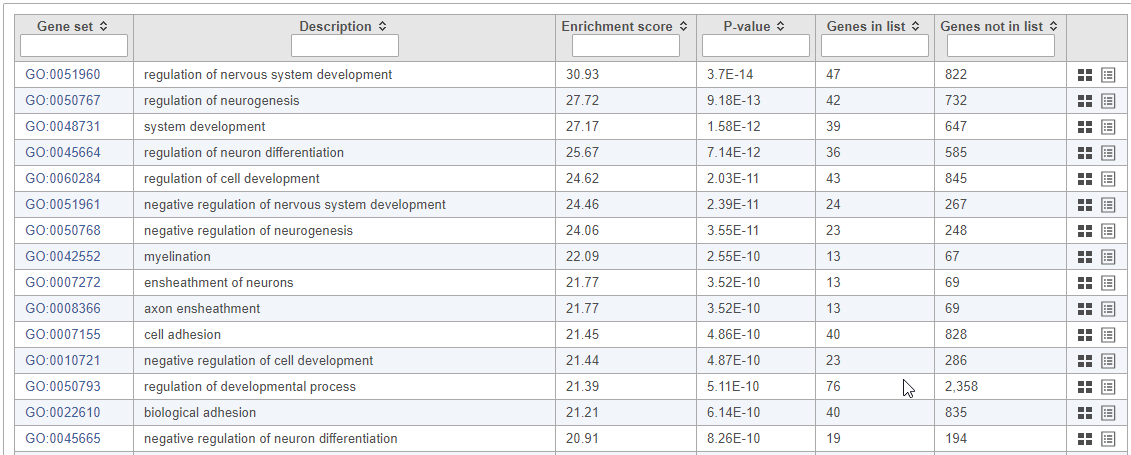
Top GO terms in the enrichment report include "myelin sheath", "ensheathment of neurons", and "axon ensheathment" (Figure 13), which corresponds well with the role of oligodendrocytes in creating the myelin sheath that supports and protect axons in the central nervous system.
| Numbered figure captions | ||||
|---|---|---|---|---|
| ||||
|
...
| Additional assistance |
|---|
| Rate Macro | ||
|---|---|---|
|
...
Overview
Content Tools