Page History
...
Differential expression analysis can be used to compare cell types. Here, we will compare glioma and oligodendrocyte cells to identify genes differentially regulated in glioma cells from the oligodendroglioma subtype. Glioma cells in oligodendroglioma are thought to originate from oligodendrocytes, thus directly comparing the two cell types will identify genes that distinguish them.
Filter
...
cells
To analyze only the oligodendroglioma subtype, we can filter the samples.
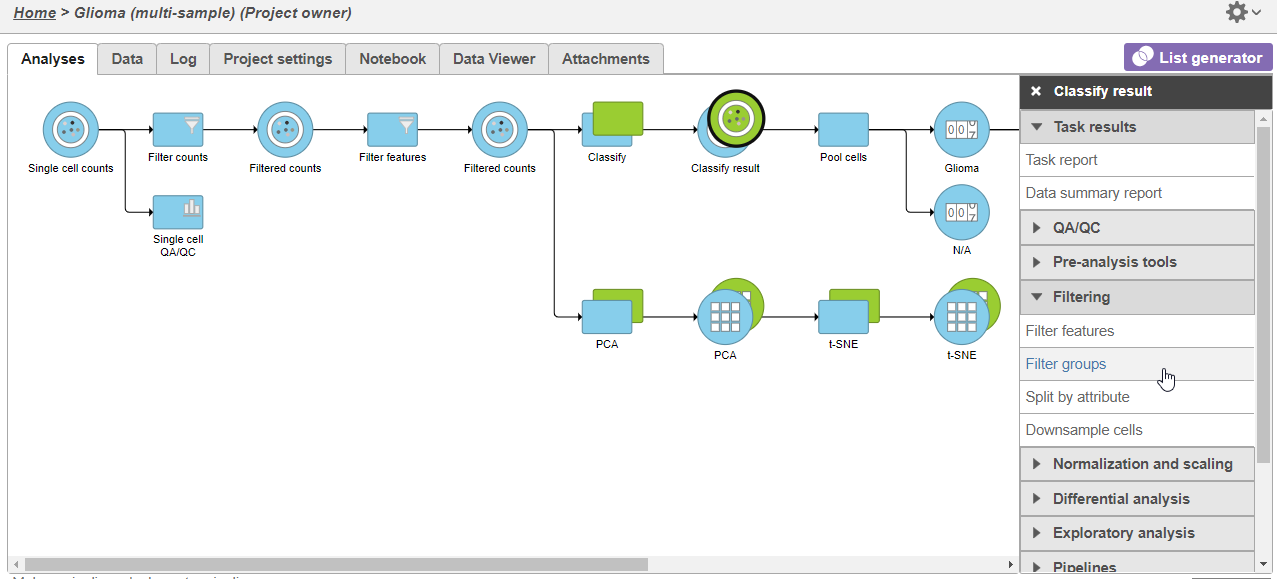
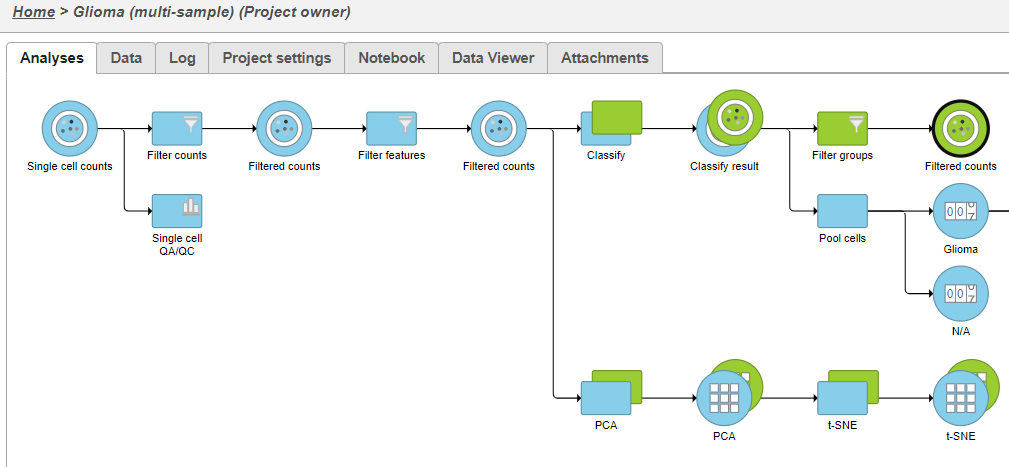
- Click the green Classified groups Filtered counts data node
- Expand Filtering in the task menu
- Click Filter groups cells (Figure 1)
| Numbered figure captions | ||||
|---|---|---|---|---|
| ||||
|
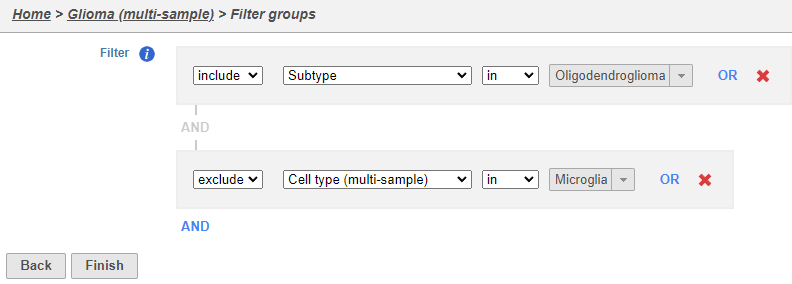
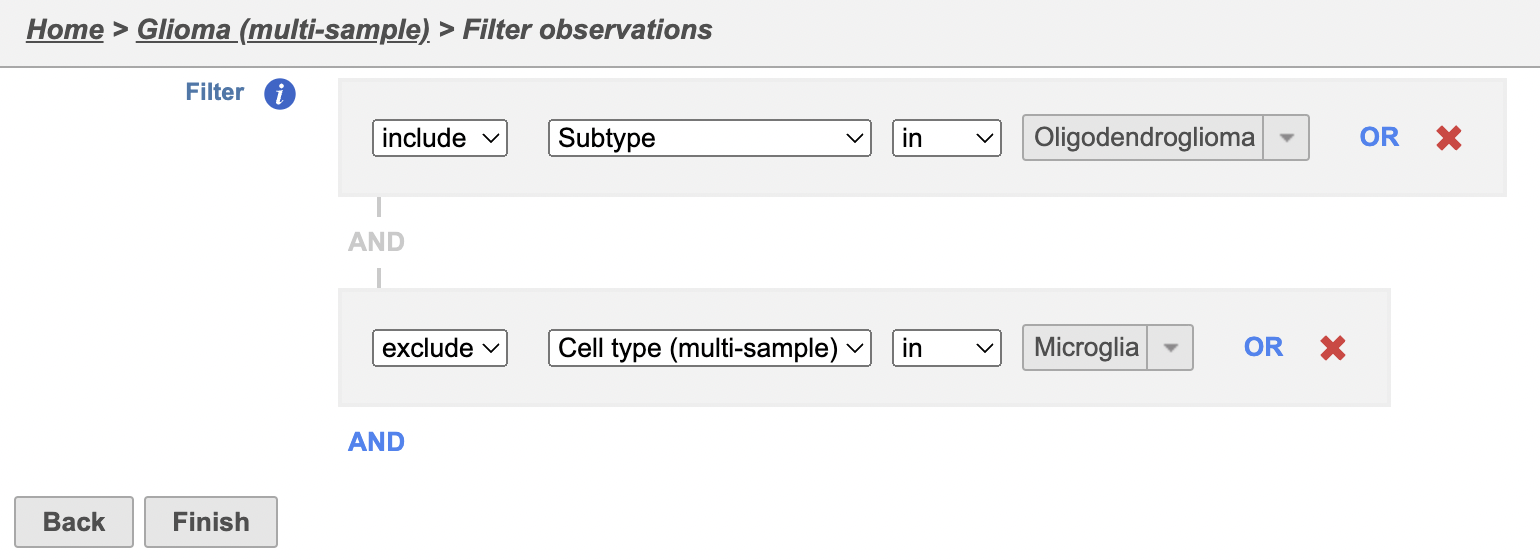
The filter lets us include or exclude samples based on sample ID and attribute.
...
| Numbered figure captions | ||||
|---|---|---|---|---|
| ||||
|
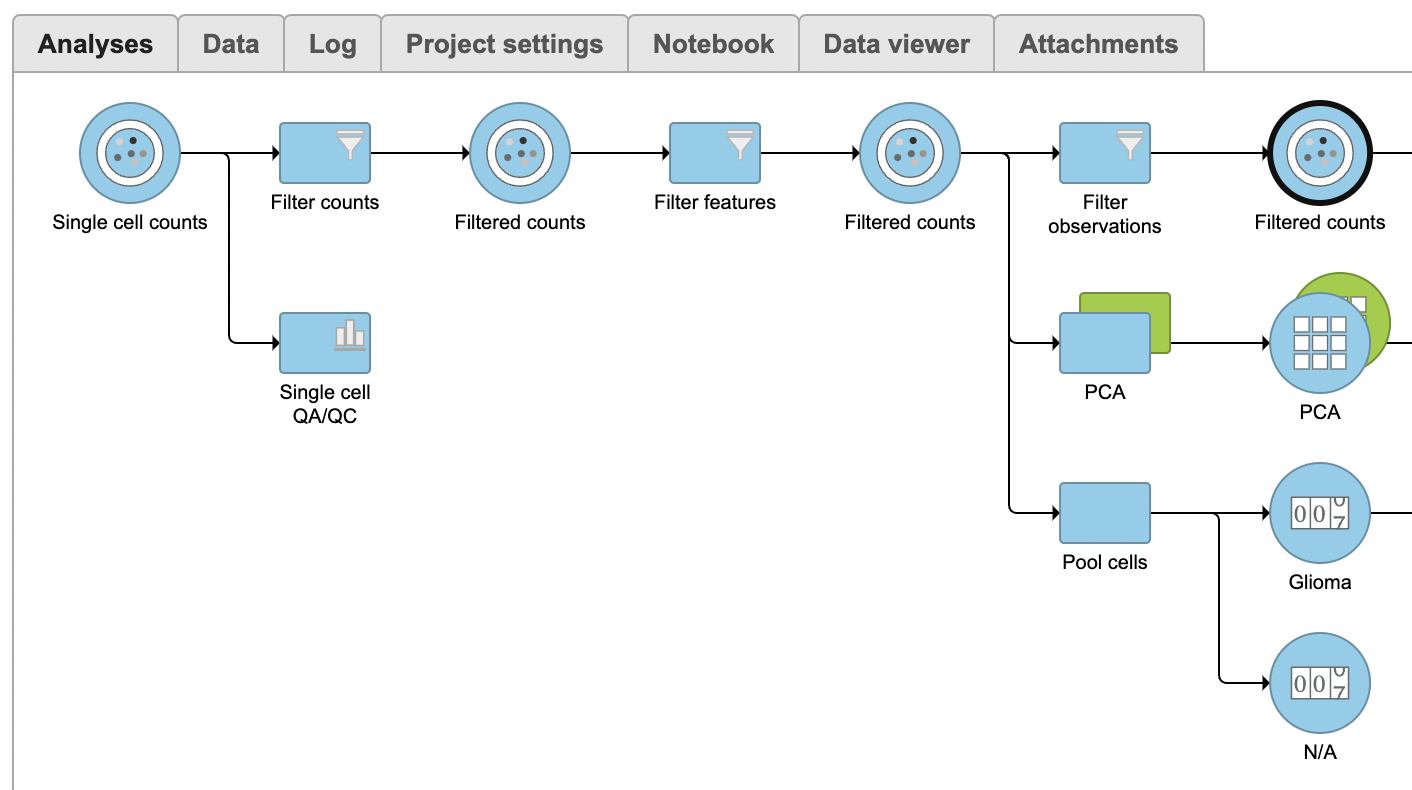
A Filtered counts data node will be created with only cells that are from oligodendroglioma samples (Figure 3).
...
| Numbered figure captions | ||||
|---|---|---|---|---|
| ||||
|
Identify differentially expressed genes
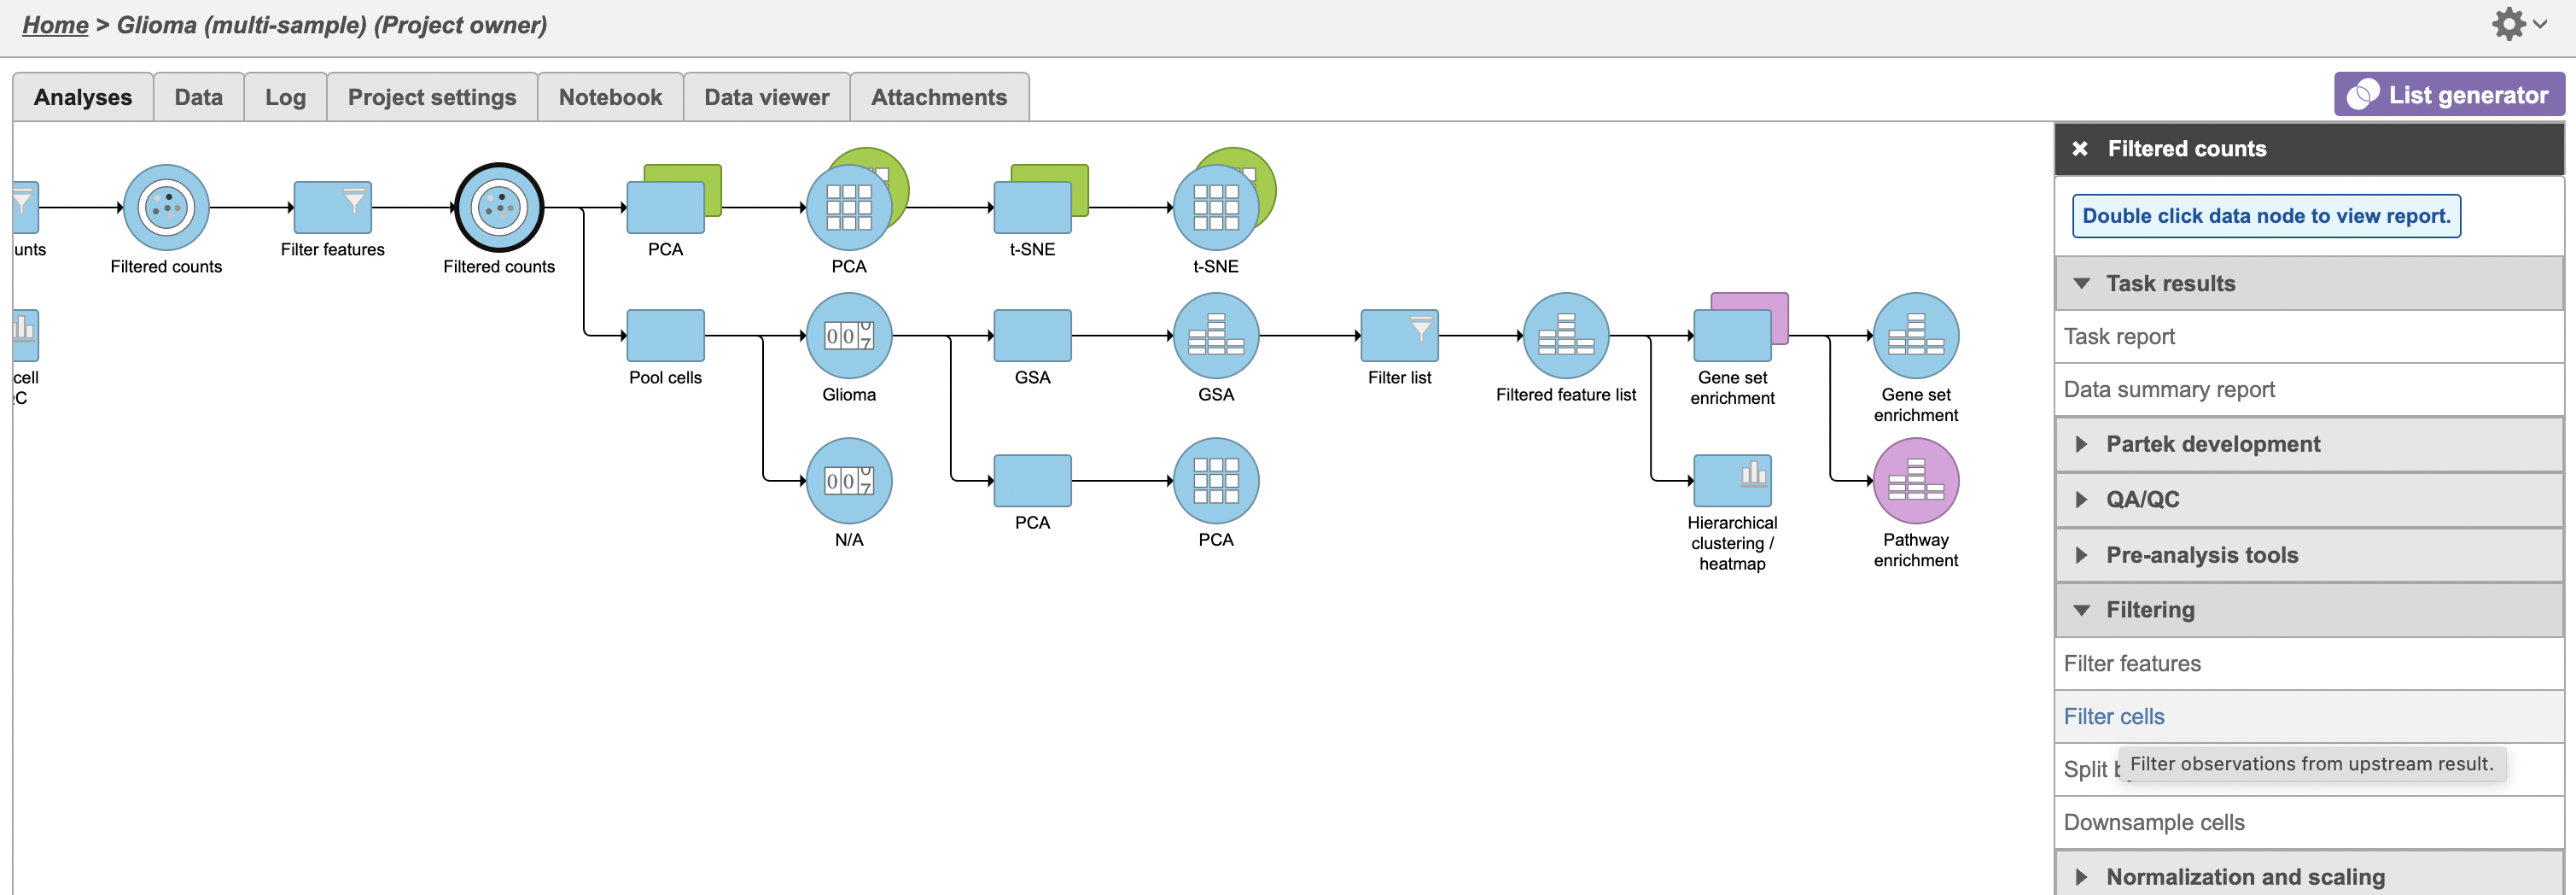
- Click the green Filtered new Filtered counts data node
- Click Click Statistics > Differential analysis in the task menu
- Click GSA
...
| Numbered figure captions | ||||
|---|---|---|---|---|
| ||||
|
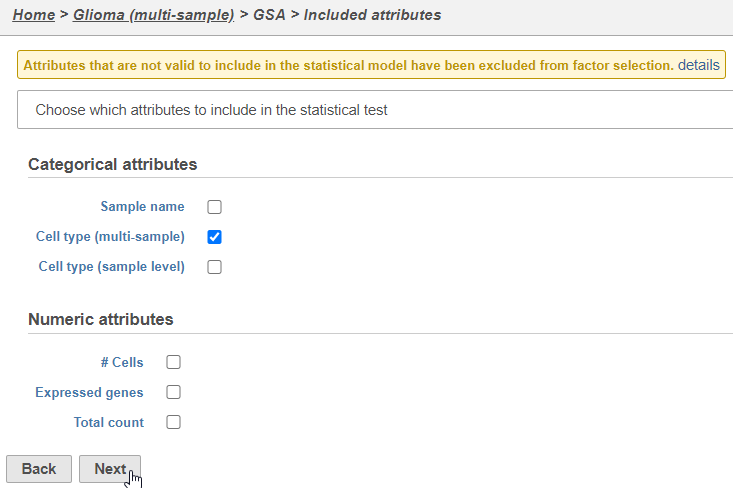
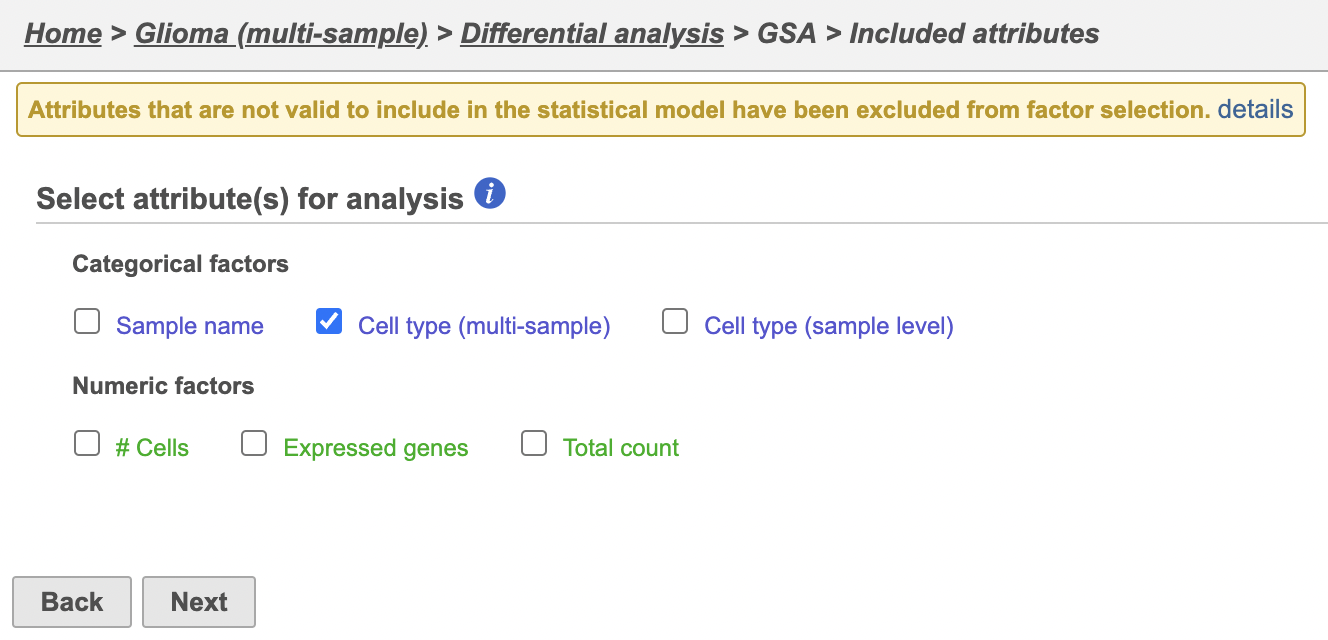
Next, we will set up a comparison between glioma and oligodendrocyte cells.
...
| Numbered figure captions | ||||
|---|---|---|---|---|
| ||||
|
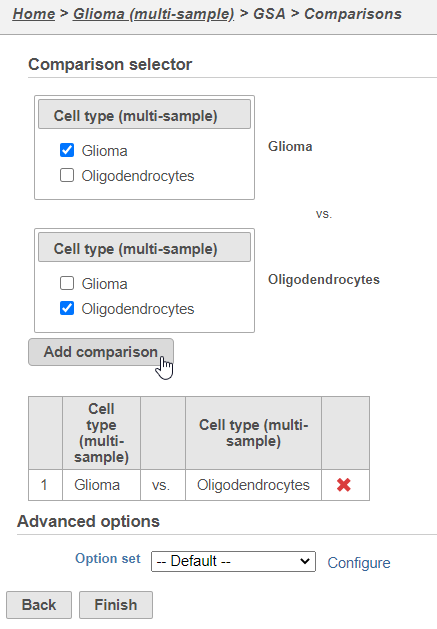
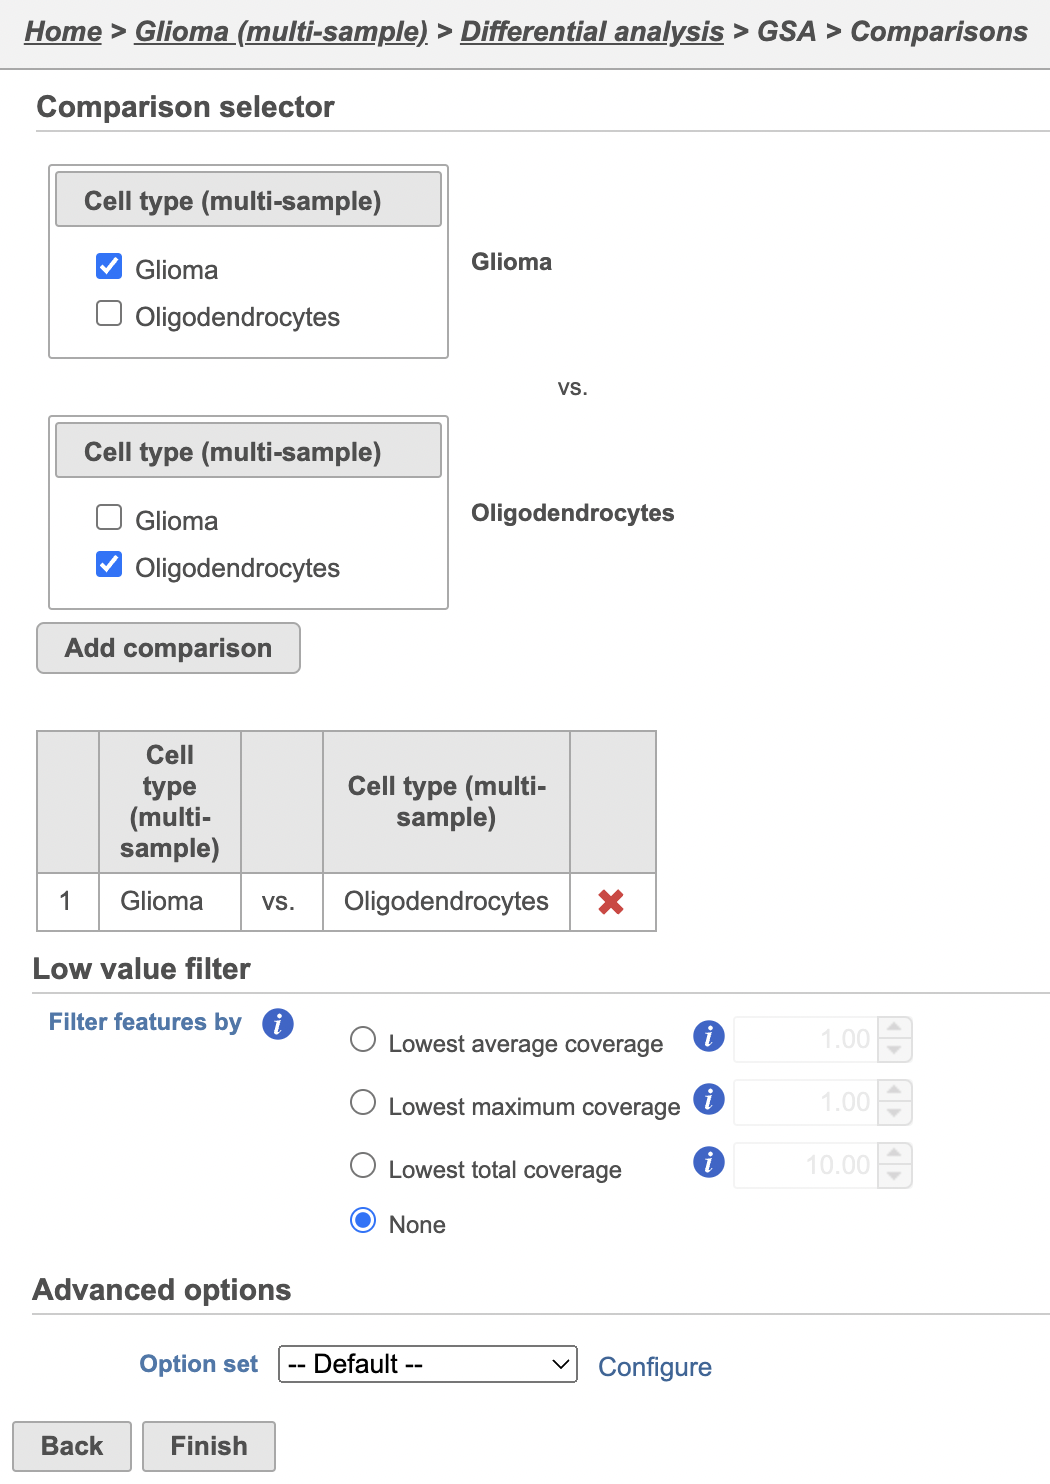
- Click Finish to run the GSA
...
- Click
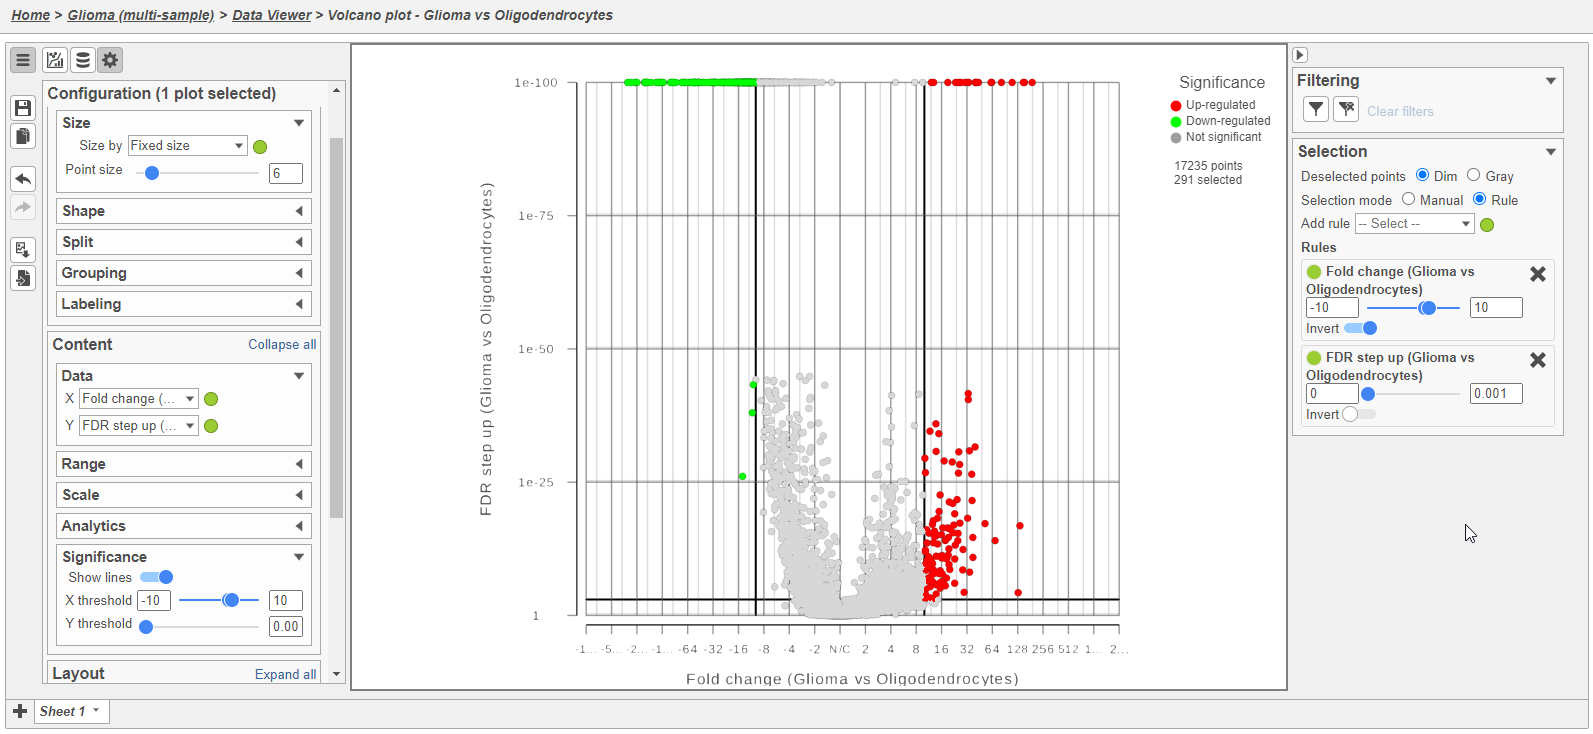
 to view the Volcano plot
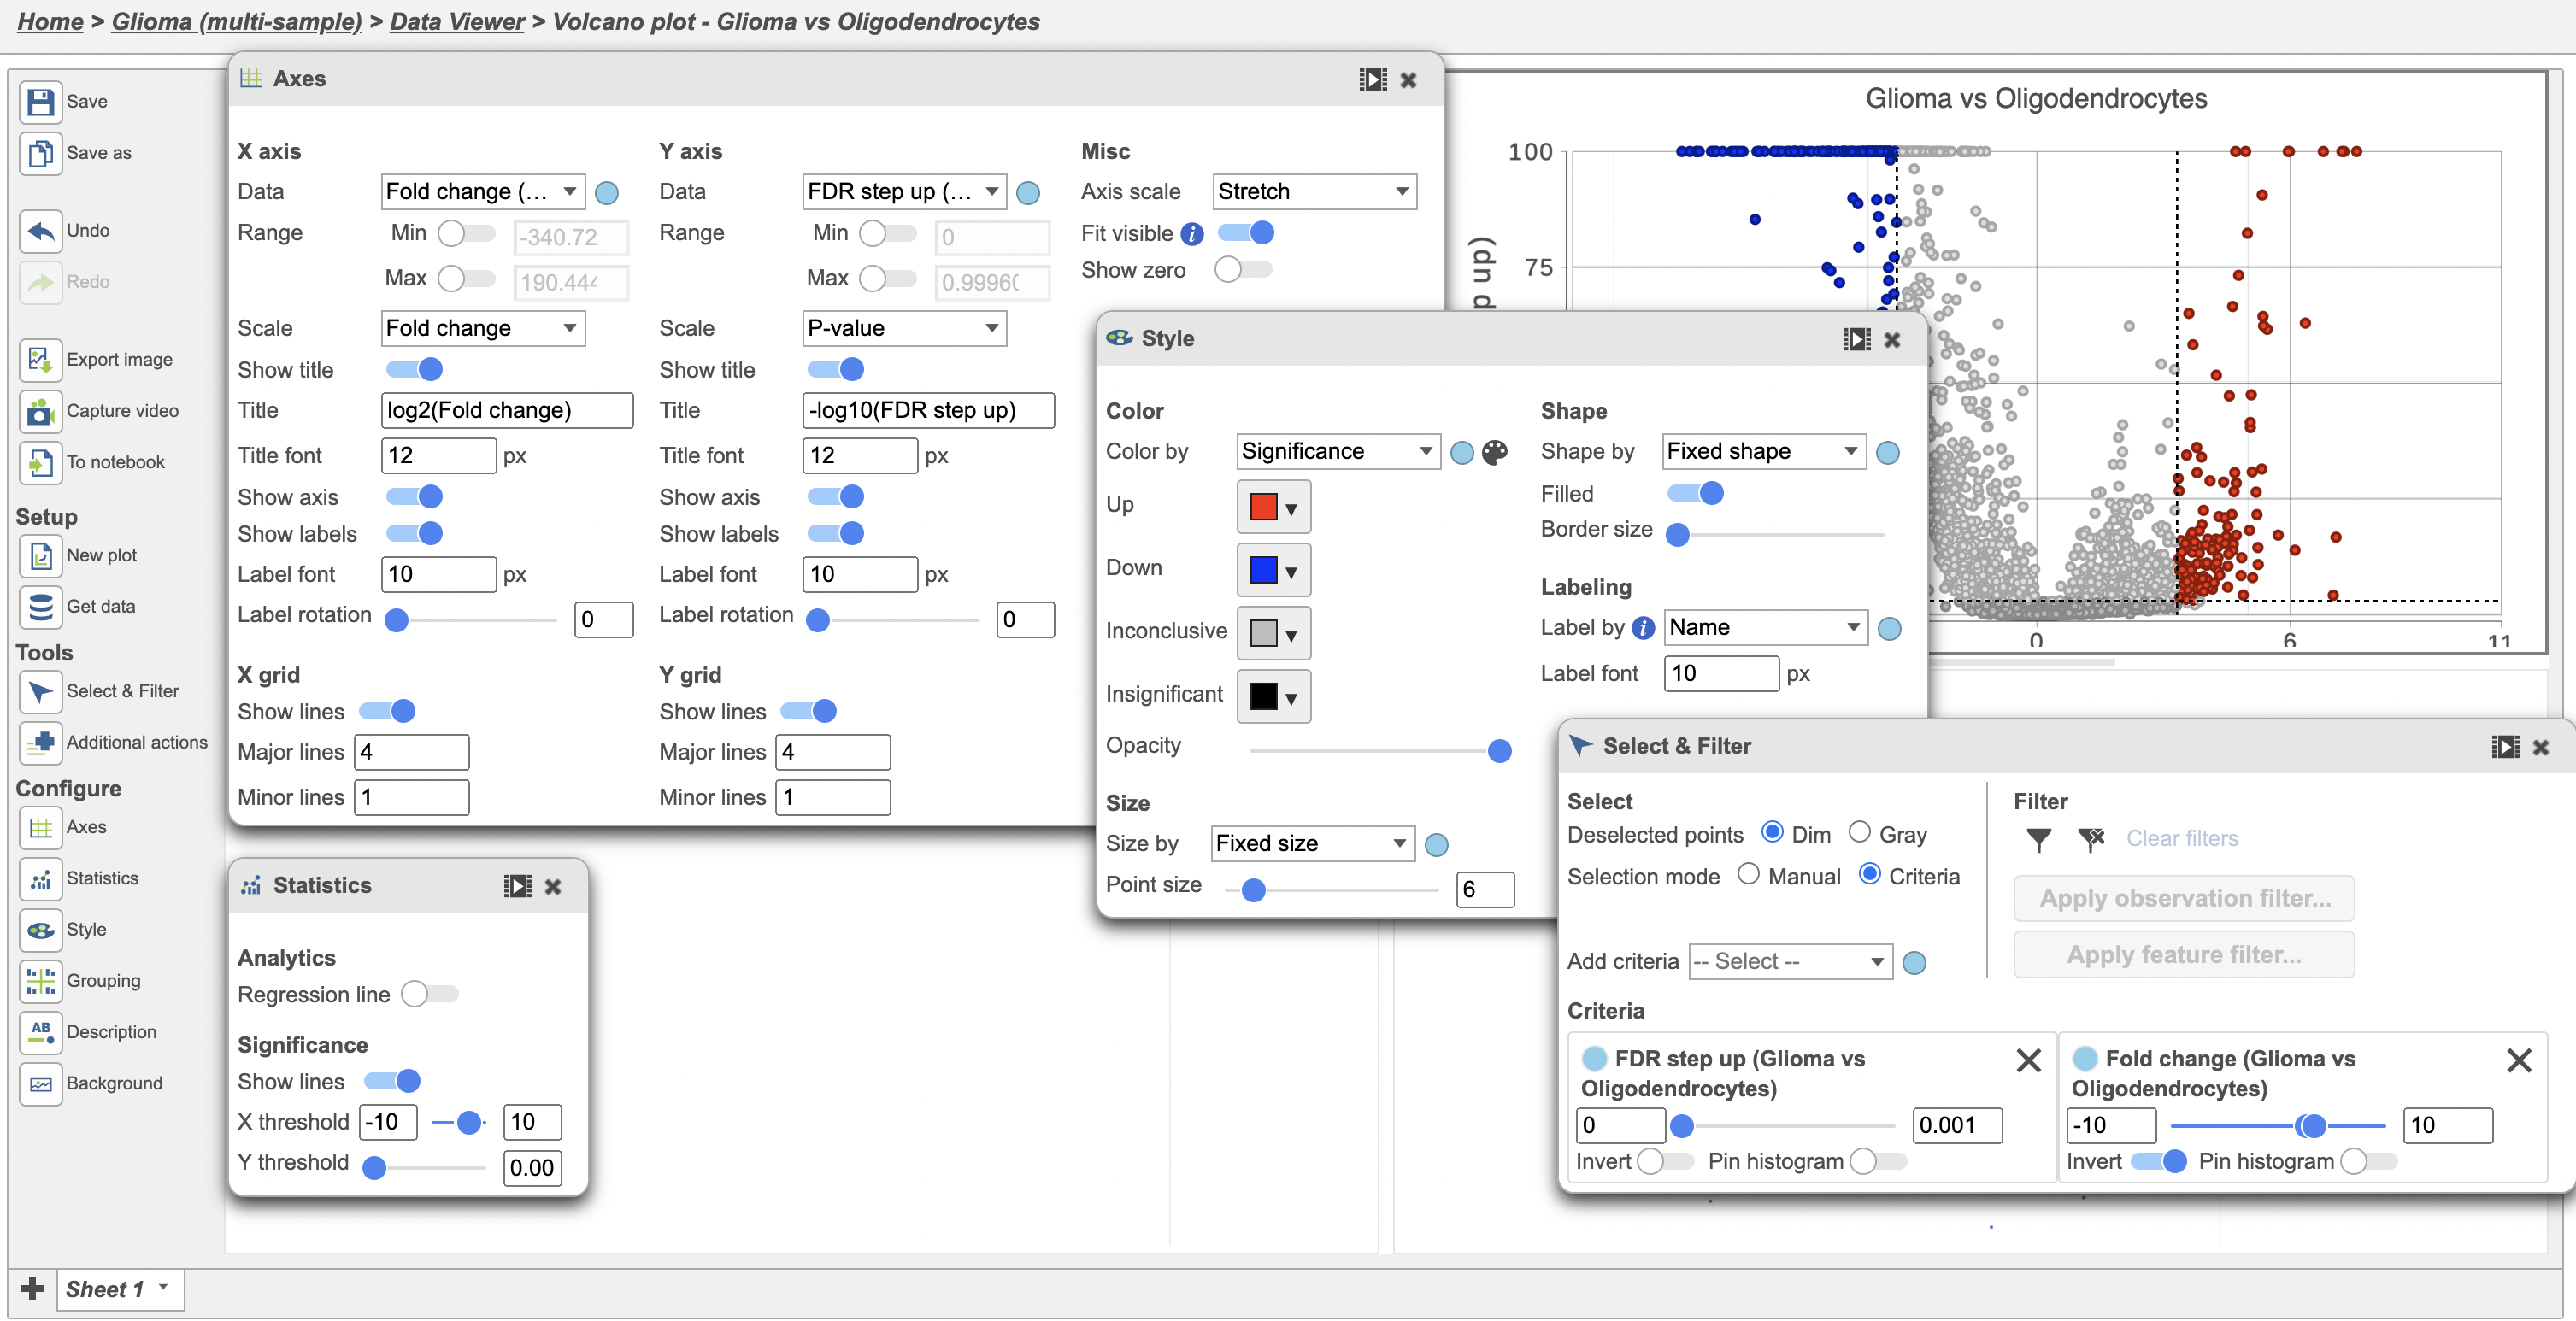
 - In the Configuration card Open the Style icon on the left, expand the Size card and increase the change Size point size to 6
- In Open the Configuration card Axes icon on the left , expand the Data card and change the Y-axis to FDR step up (Glioma vs Oligodendrocytes)
- In the Configuration card on the left, expand the Significance card and change Open the Statistics icon and change the Significance of X threshold to -10 and 10 and the Y threshold to 0.001
- In the Selection card on the rightOpen the Select & Filter icon, set the Fold change thresholds to -10 and 10
- In the Selection card on the right Select & Filter, click
 to remove the P-value (Glioma vs Oligodendrocytes) selection rule. From the drop-down list, add FDR step up (Glioma vs Oligodendrocytes) as a selection rule and set the maximum to 0.001
This gives 291 significant differentially expressed genes Note these changes in the icon settings and volcano plot below (Figure 6).
| Numbered figure captions | ||||
|---|---|---|---|---|
| ||||
|
We can now recreate these conditions in the GSA report filter.
...
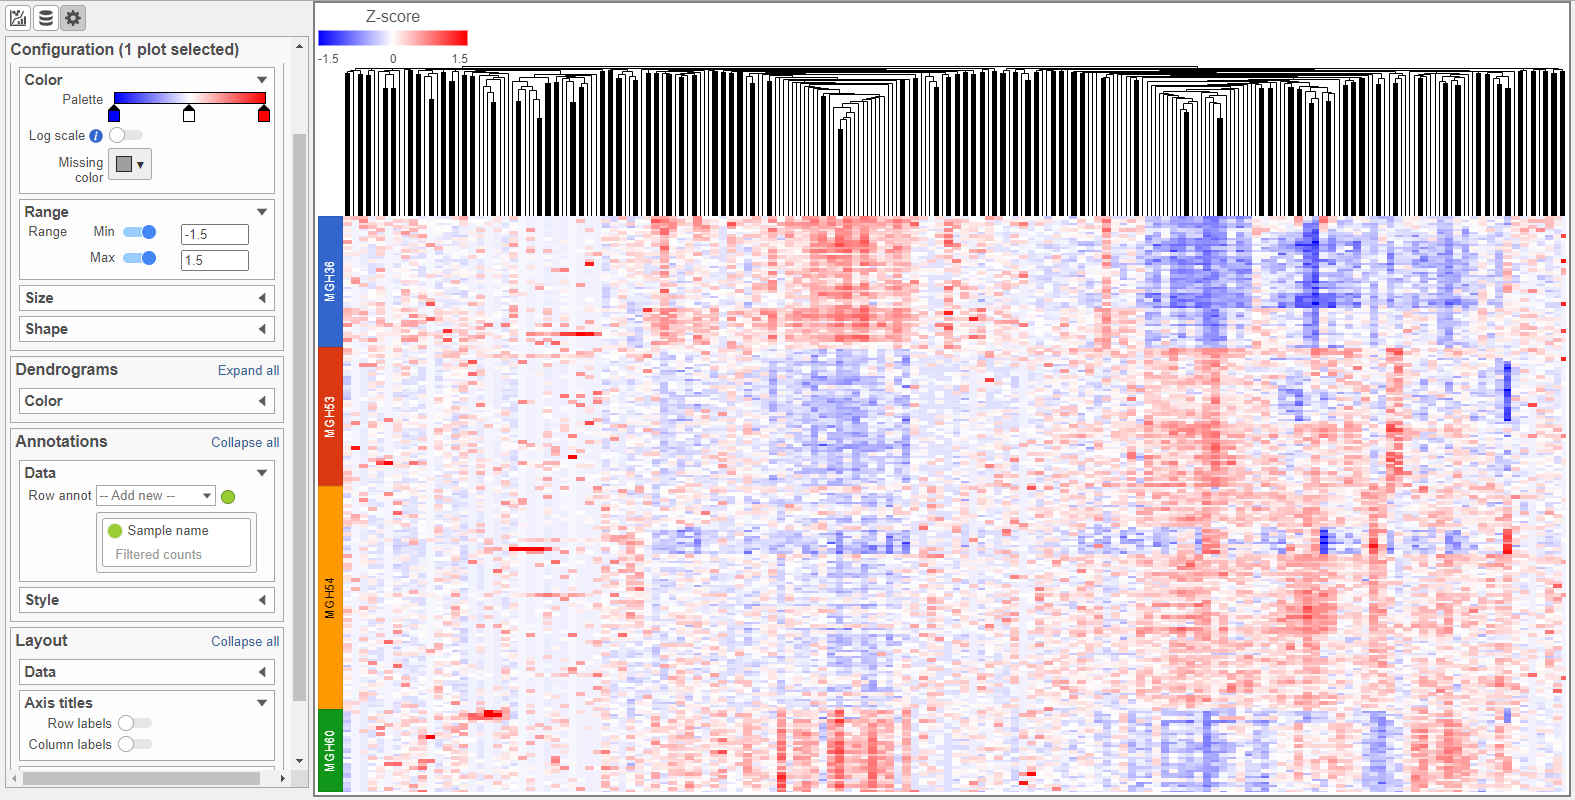
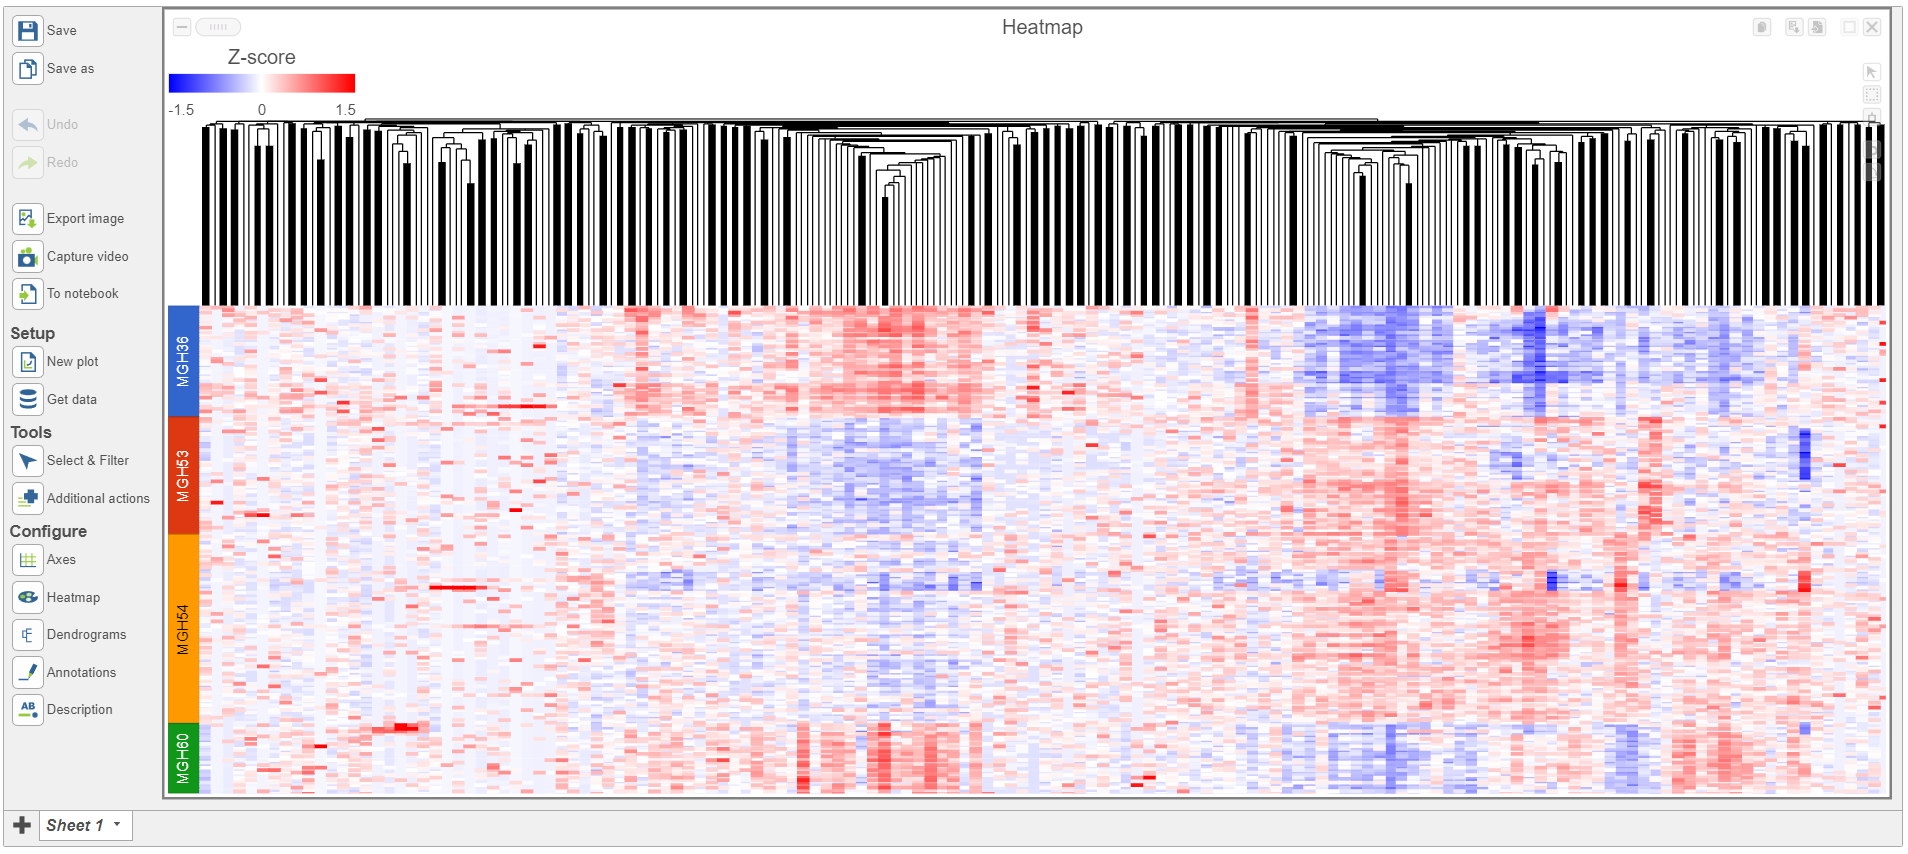
To visualize the results, we can generate a hierarchical clustering heatmap.
- Click thegreen Filtered Filtered feature list produced by the Differential analysis filter task
- Click Exploratory analysis in the task menu
- Click Hierarchical clustering/heatmap
...
| Numbered figure captions | ||||
|---|---|---|---|---|
| ||||
|
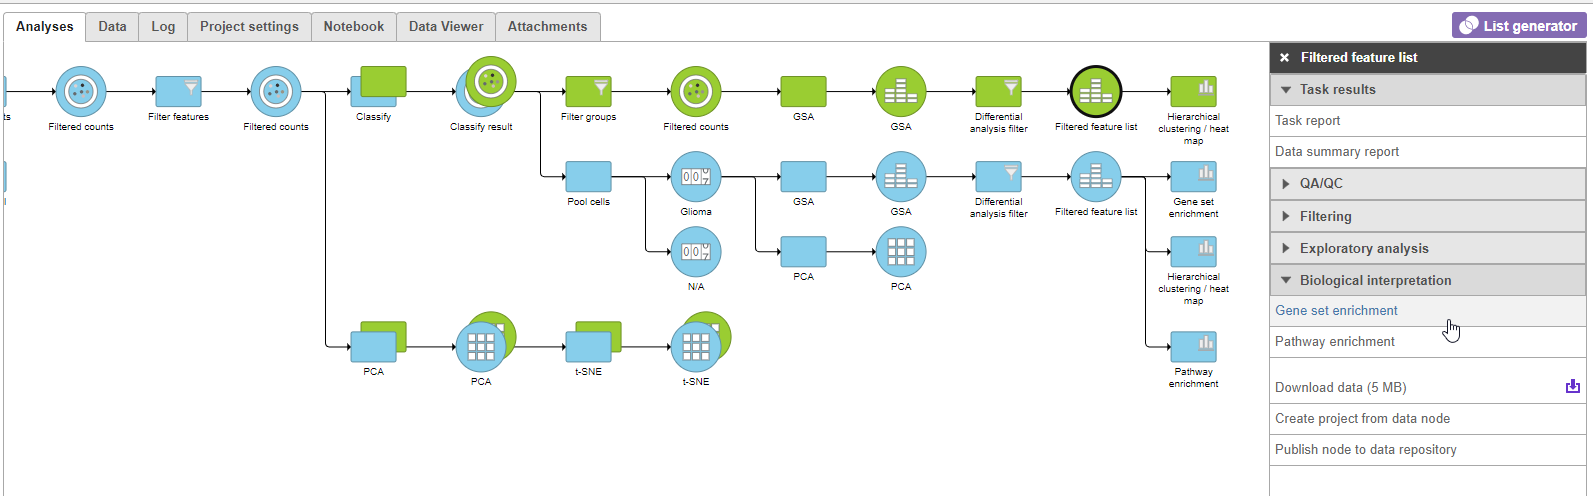
- Click Glioma (multi-sample) to return to the Analyses tab.
We can use gene set enrichment to further characterize the differences between glioma and oligodendrocyte cells.
- Click thegreen Filtered Filtered feature list node
- Click Biological interpretation in the task menu
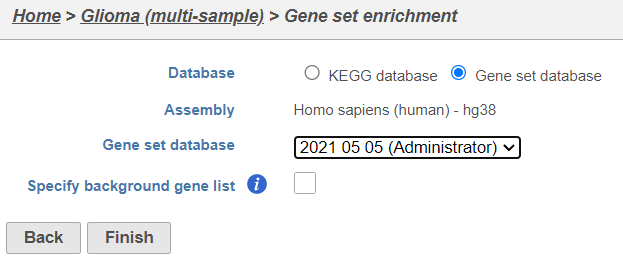
- Click Gene set enrichment
- Change Database to Gene set database and click Finish to continue with the most recent gene set (Figure 9)
| Numbered figure captions | ||||
|---|---|---|---|---|
| ||||
|
- Select Finish to continue with the most recent gene set
|
A Gene set enrichment node will be added to the pipeline .
- Double-click the green the Gene set enrichment task node to open the task report
...
Overview
Content Tools