Page History
...
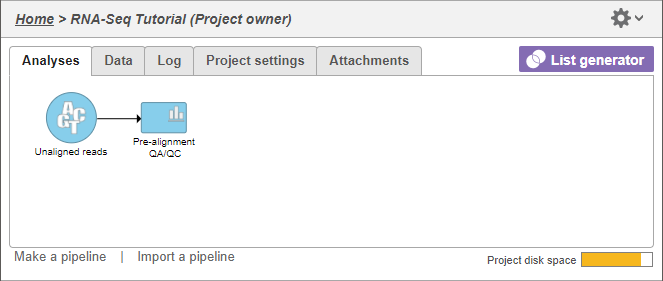
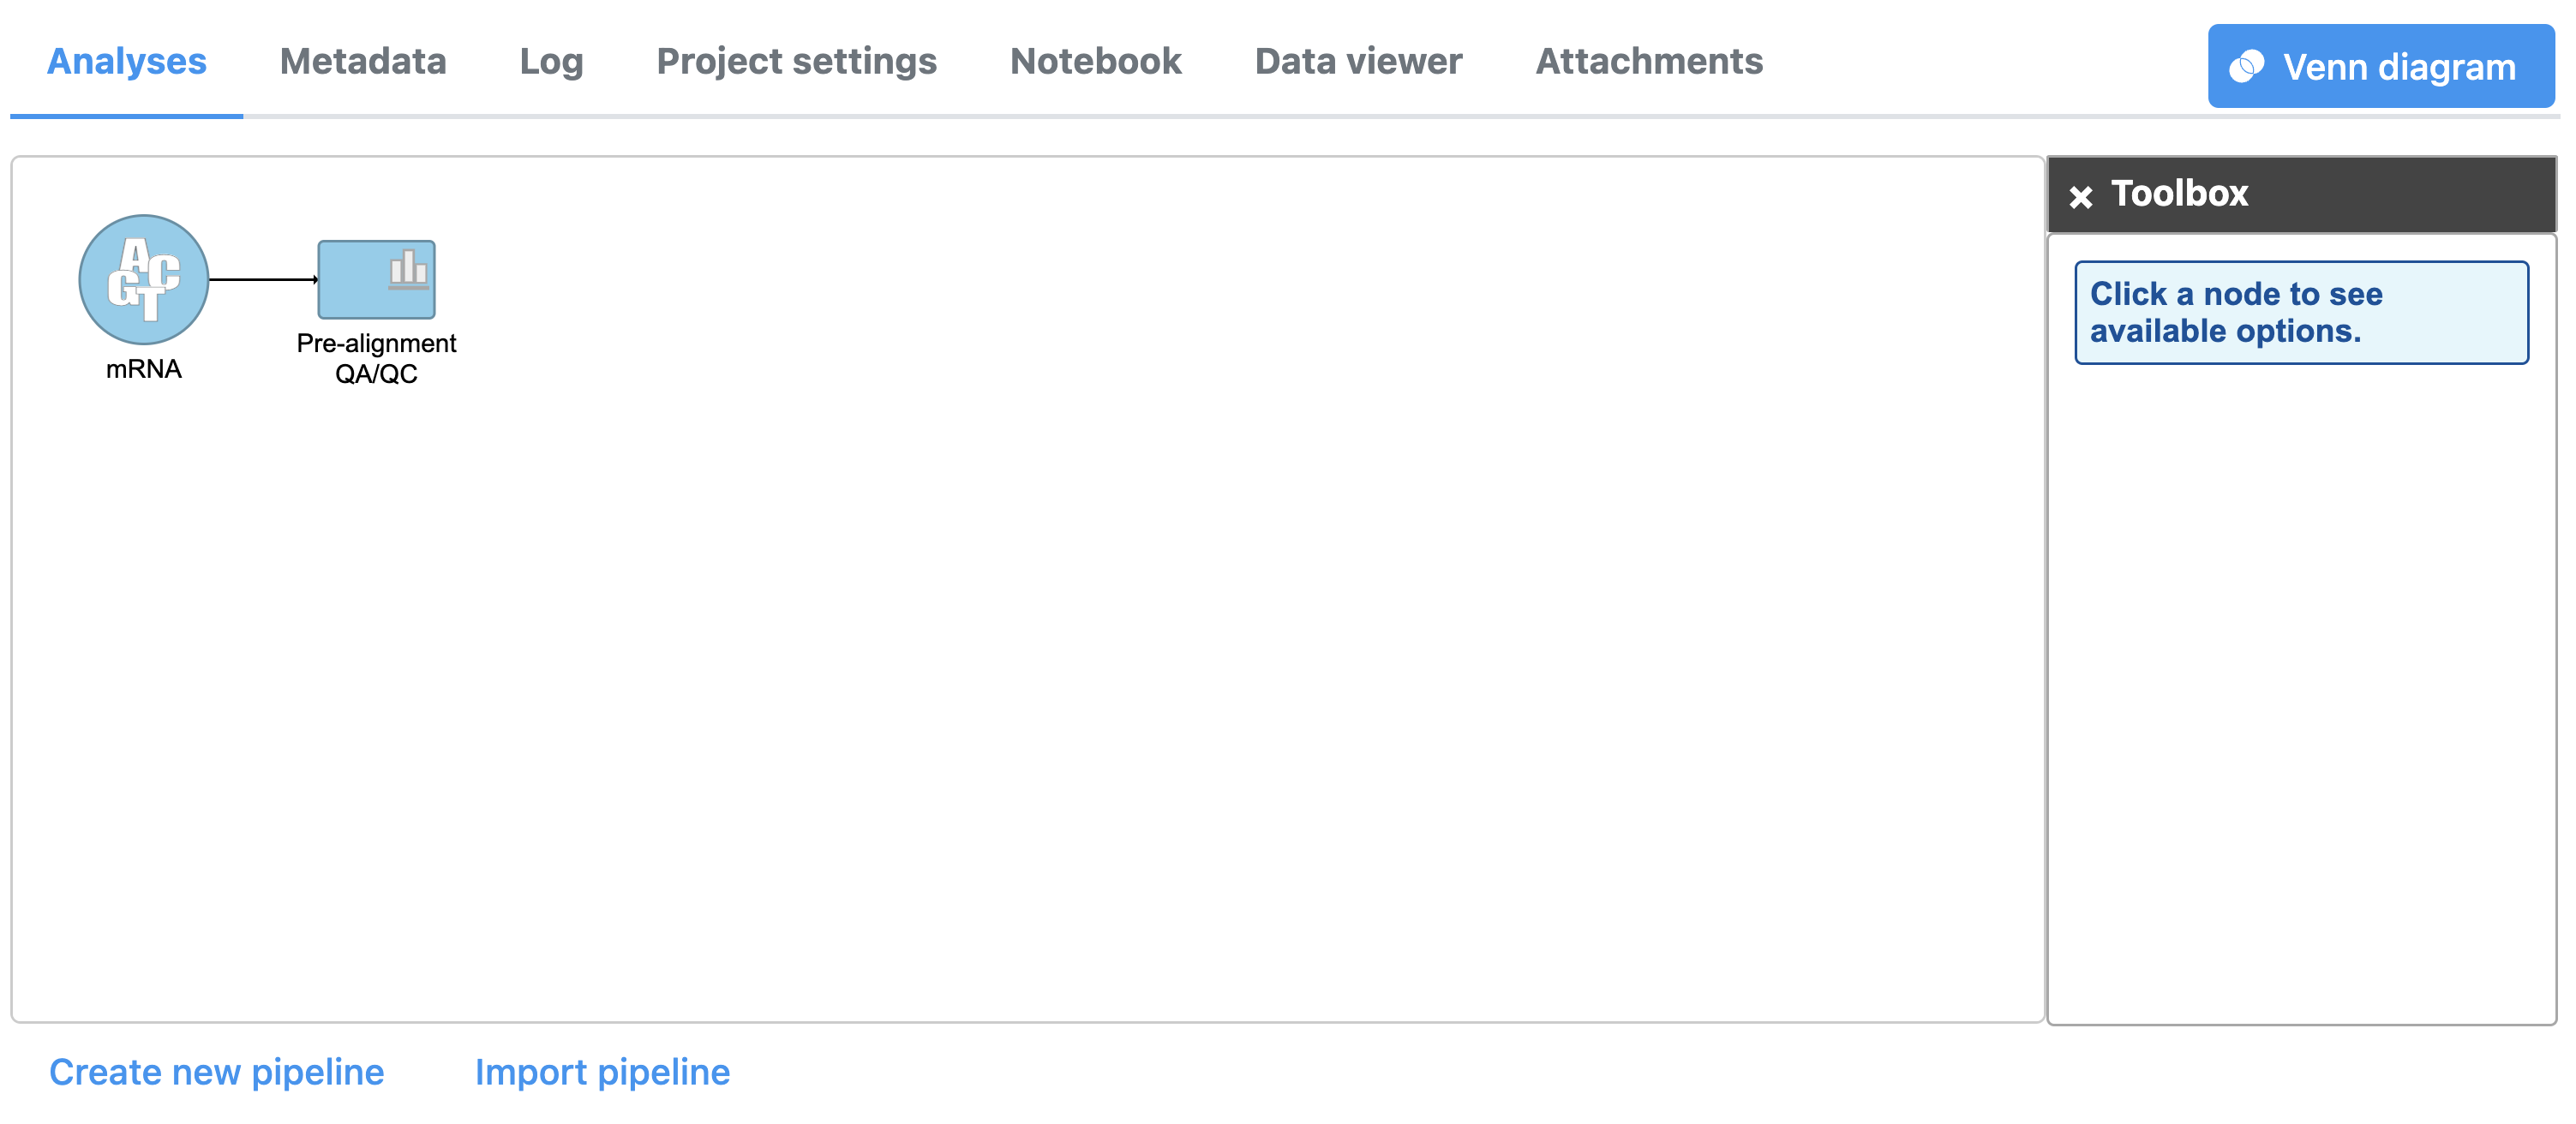
In the Analysis tab, data are represented as circles, termed data nodes. One data node, Unaligned readsmRNA, should be visible in the Analysis tab (Figure 1).
| Numbered figure captions | ||||
|---|---|---|---|---|
| ||||
|
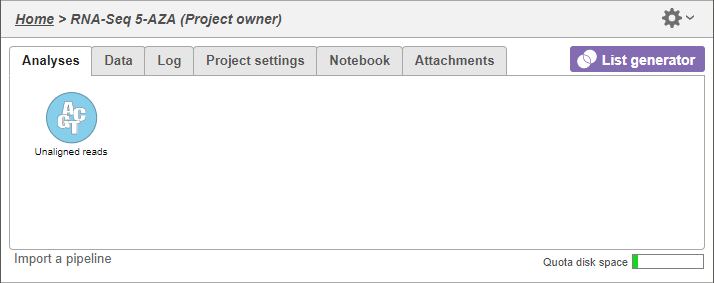
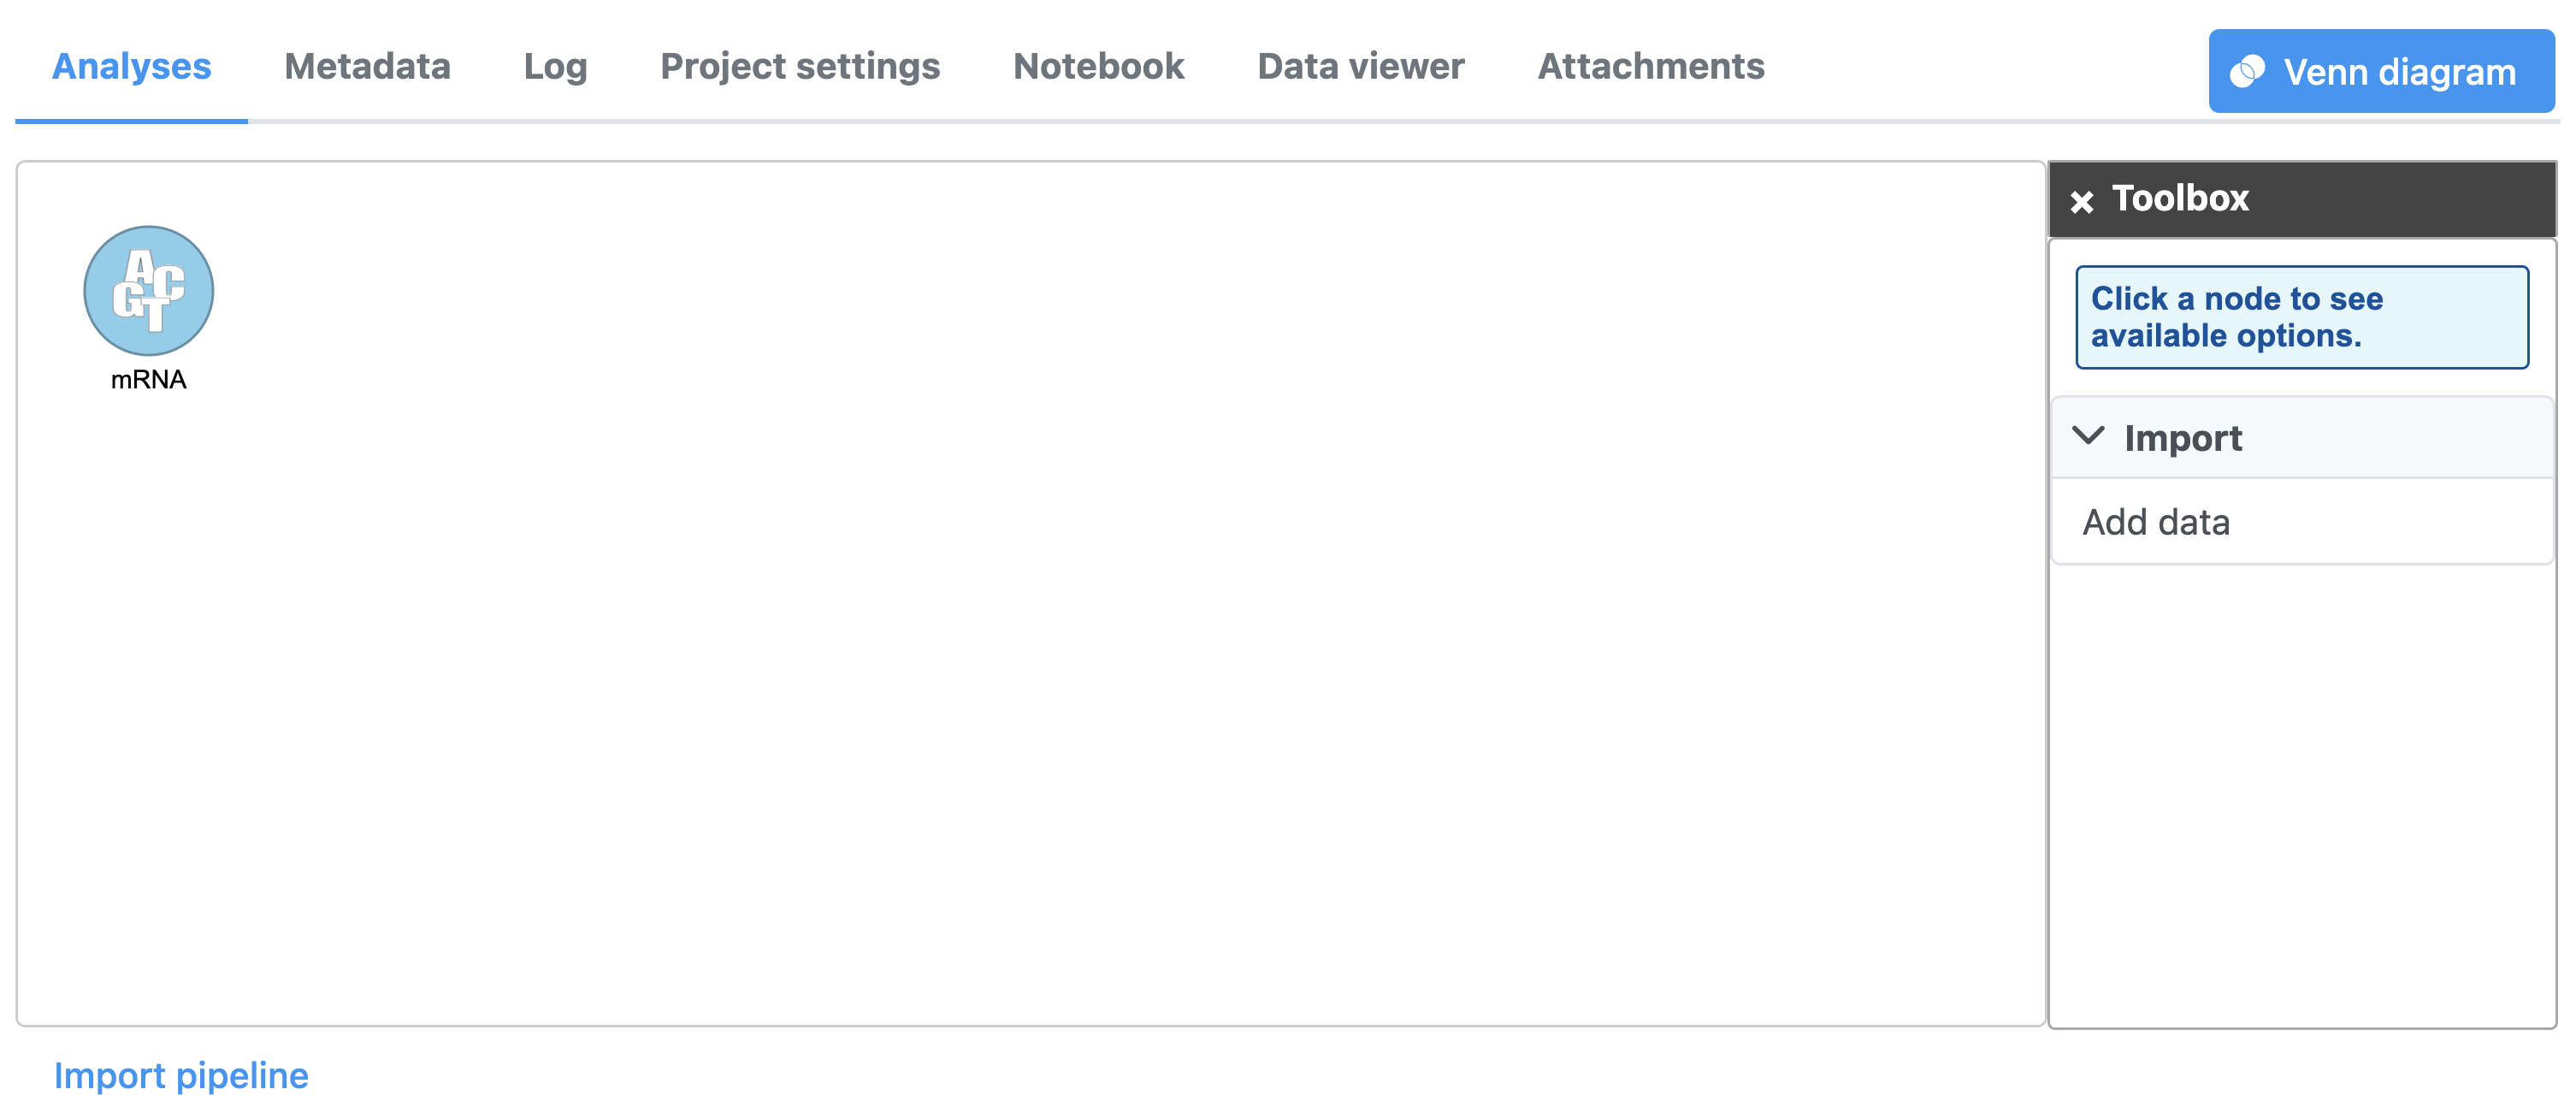
- Click the Unaligned reads mRNA node
Clicking a data node brings up the context-sensitive task menu with tasks that can be performed on the data node (Figure 2).
| Numbered figure captions | ||||
|---|---|---|---|---|
| ||||
|
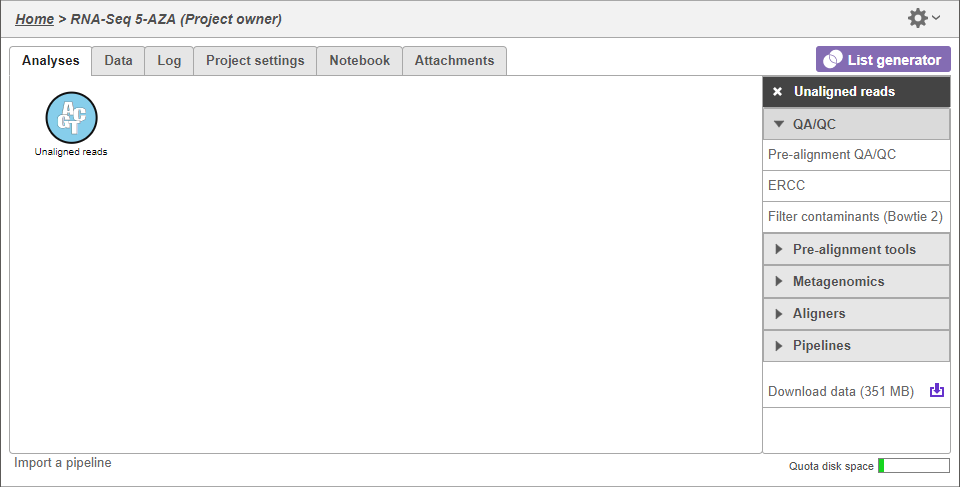
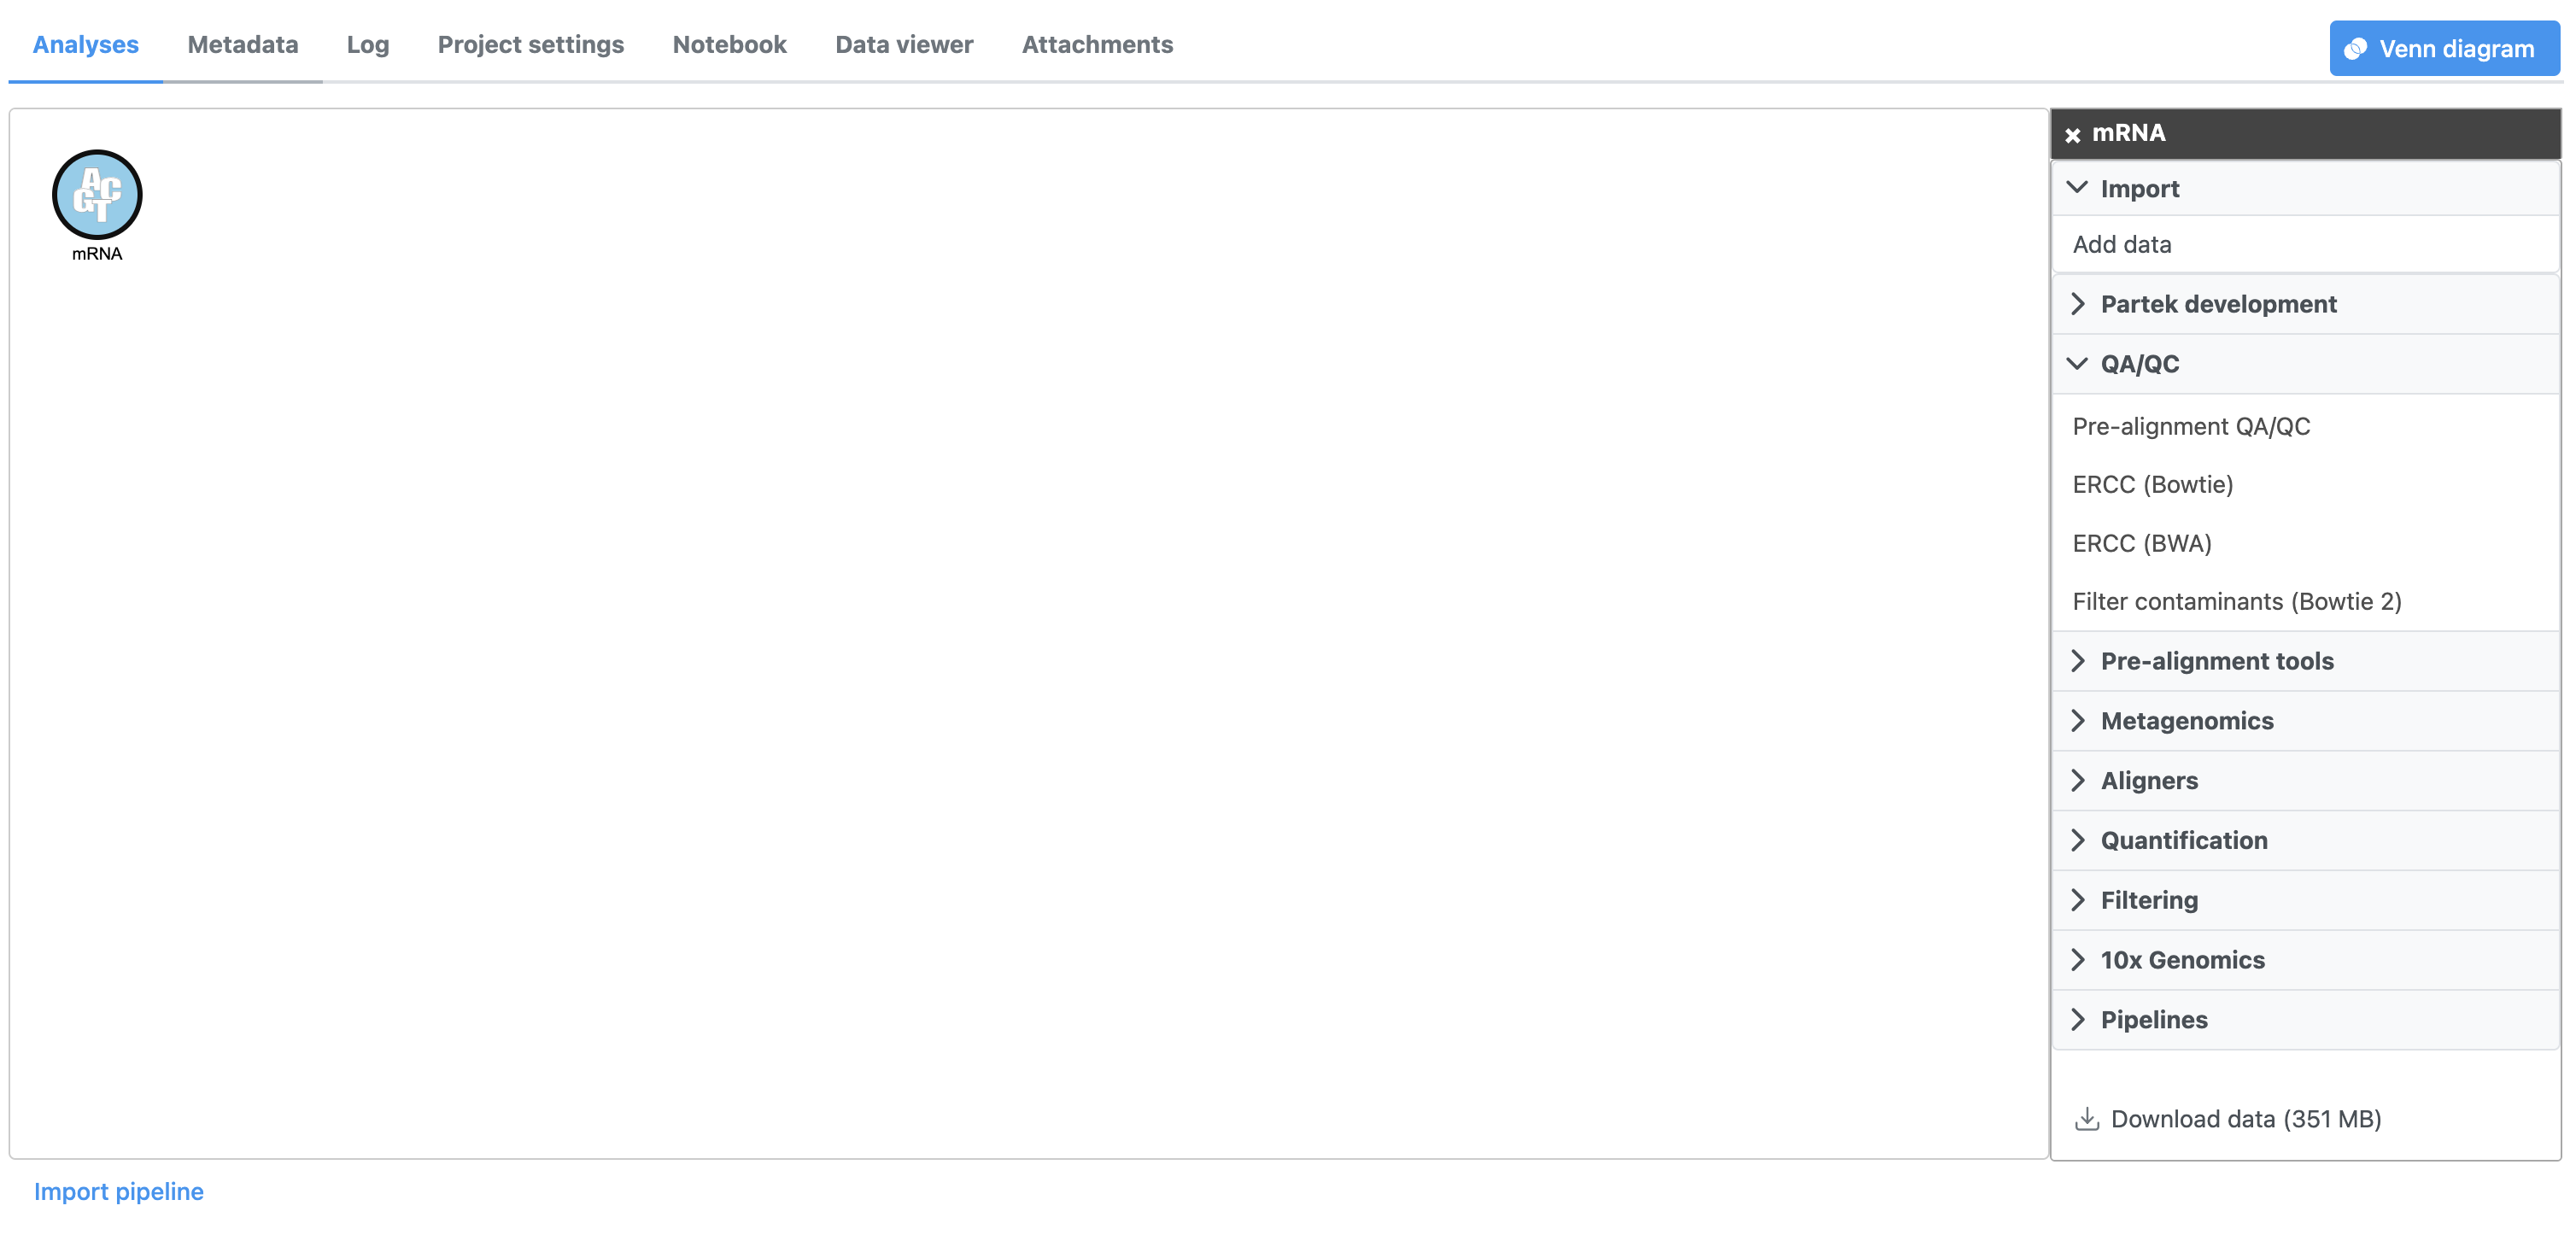
Pre-alignment QA/QC assesses the quality of the unaligned reads and will help us determine whether trimming or filtering is necessary.
...
Running a task creates a task node, e.g. the blue rectangle labeled Pre-alignment QA/QC (Figure 3). The task node , which contains details on the task and a report.. While tasks have been queued or are in progress they have a lighter color. Any output nodes that the task will generate are also displayed in a lighter color until the task completes. Once the task begins running, a progress bar is displayed on the task node.
| Numbered figure captions | ||||
|---|---|---|---|---|
| ||||
|
- Click the Pre-alignment QA/QC node
The context-sensitive task menu (Figure 4) shows the option to view the Task report and the Task details. You can also access a task report by double-clicking on a task node.
| Numbered figure captions | ||||
|---|---|---|---|---|
| ||||
|
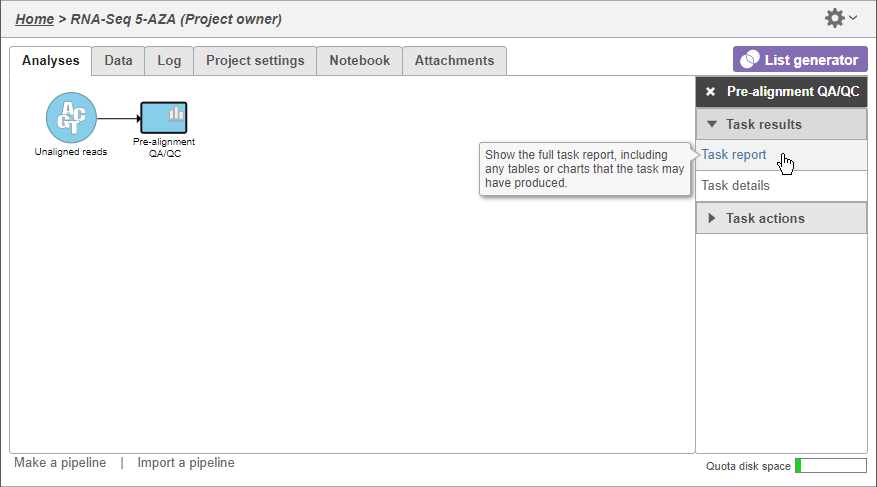

- Click Task report
Pre-aligment QA/QC provides information about the sequencing quality of unaligned reads (Figure 5). Both project level summaries and sample-level summaries are provided.
| Numbered figure captions | ||||
|---|---|---|---|---|
| ||||
|
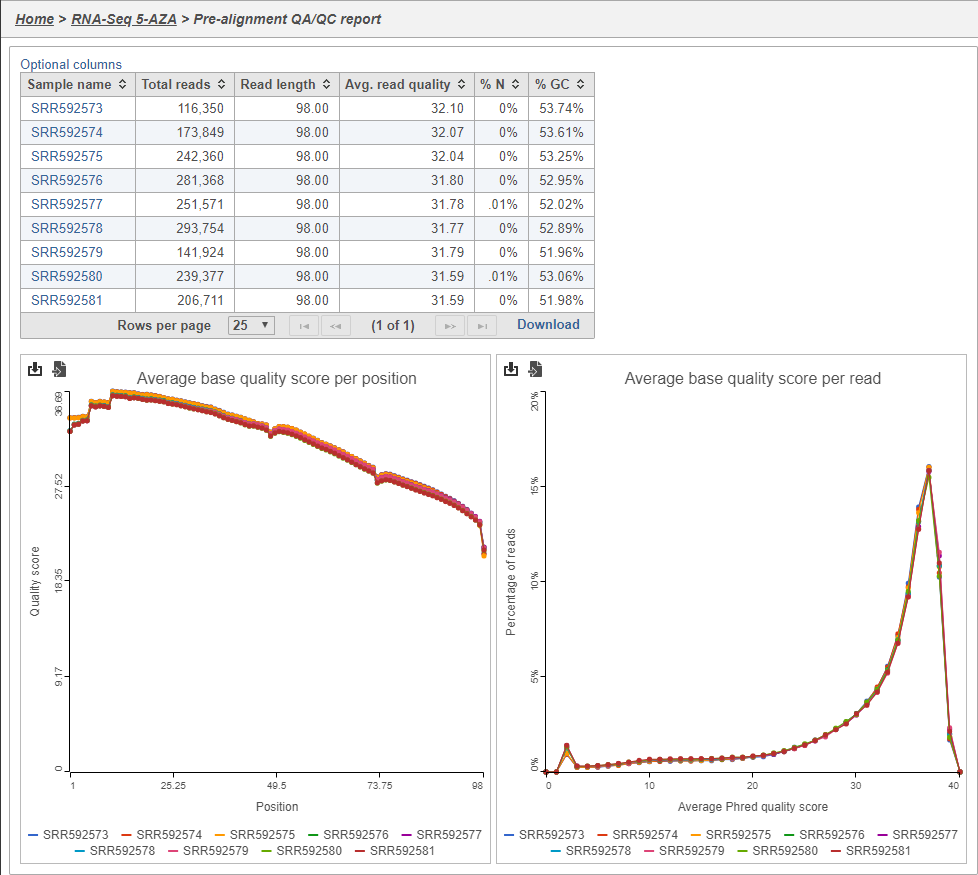
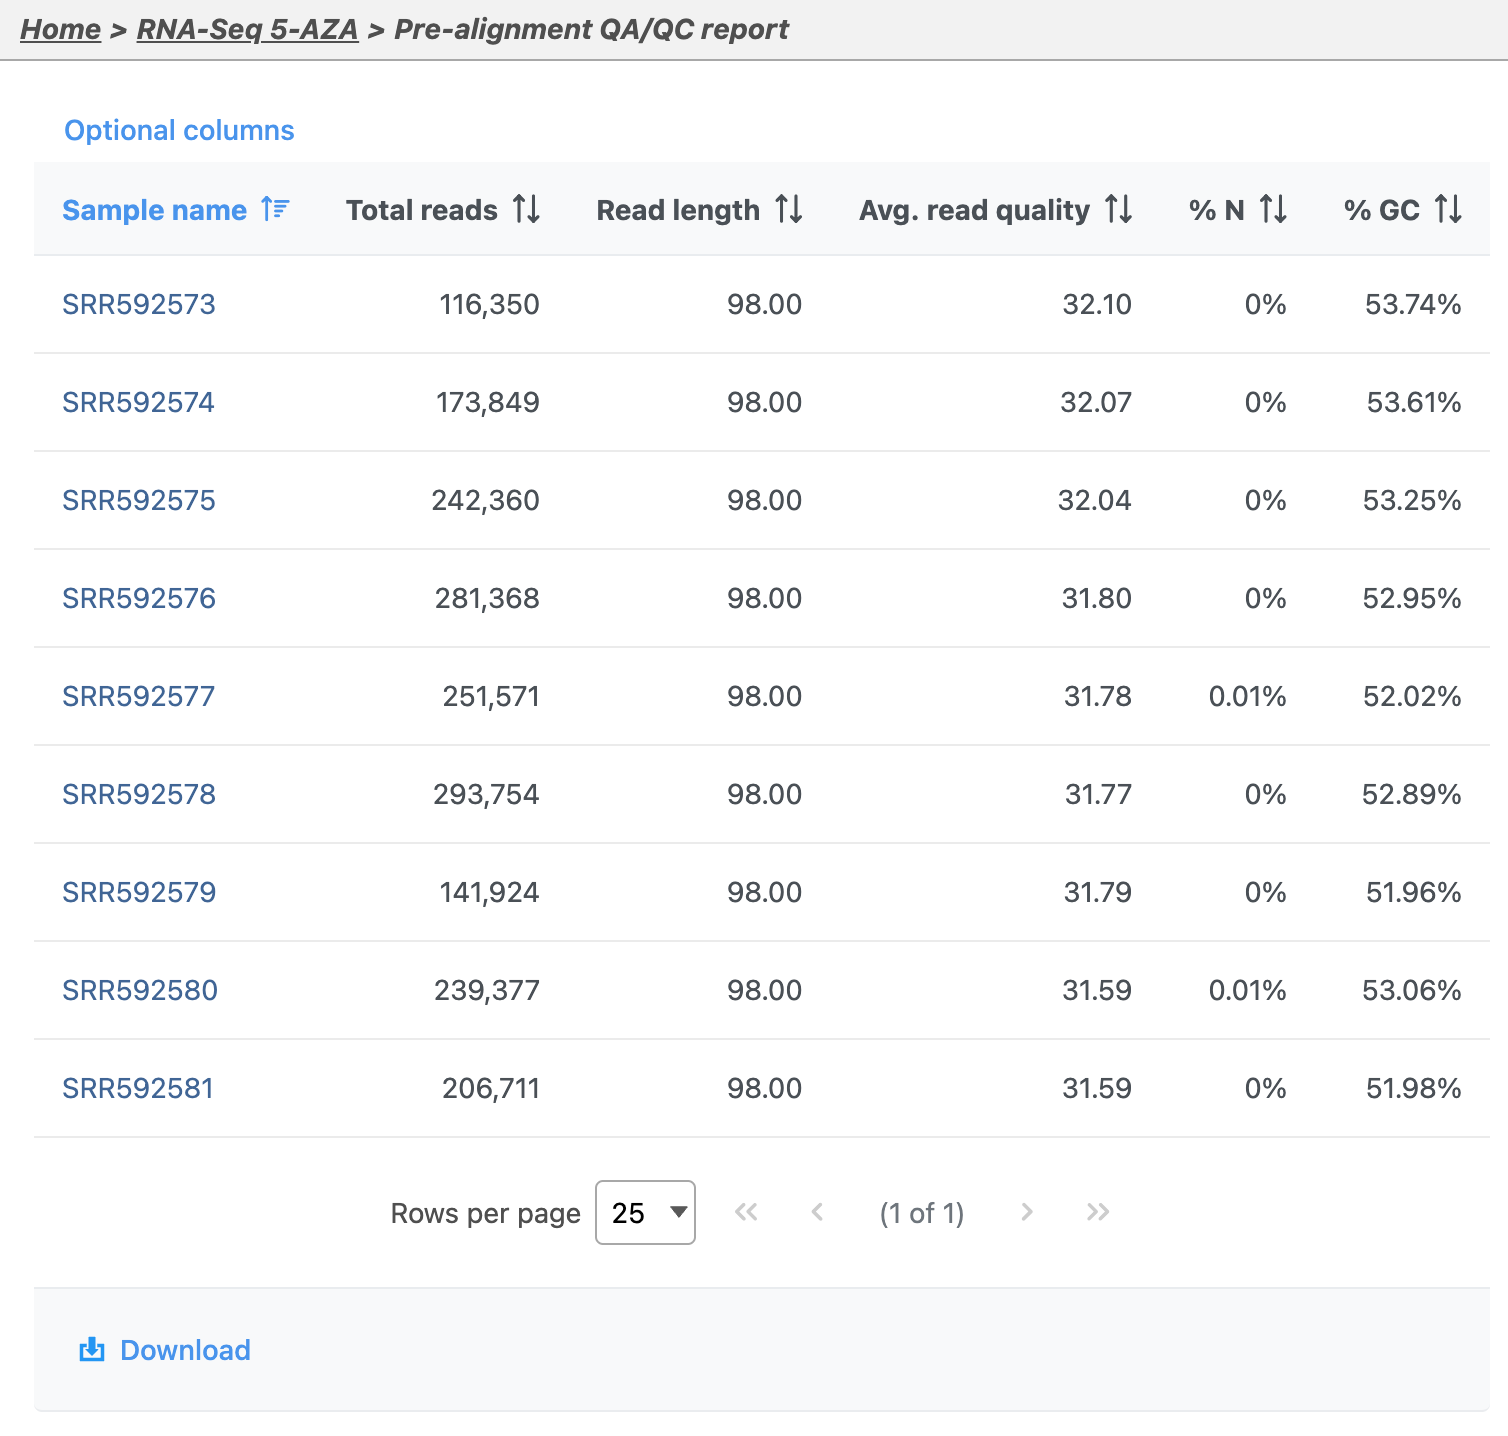
- Click sample SSR592573 in the data table of the report to open its sample-level report
The Average base quality score per position graph in the upper right-hand panel (Figure 6) gives the average Phred score for each position in the reads.
| Numbered figure captions | ||||
|---|---|---|---|---|
|
...
|
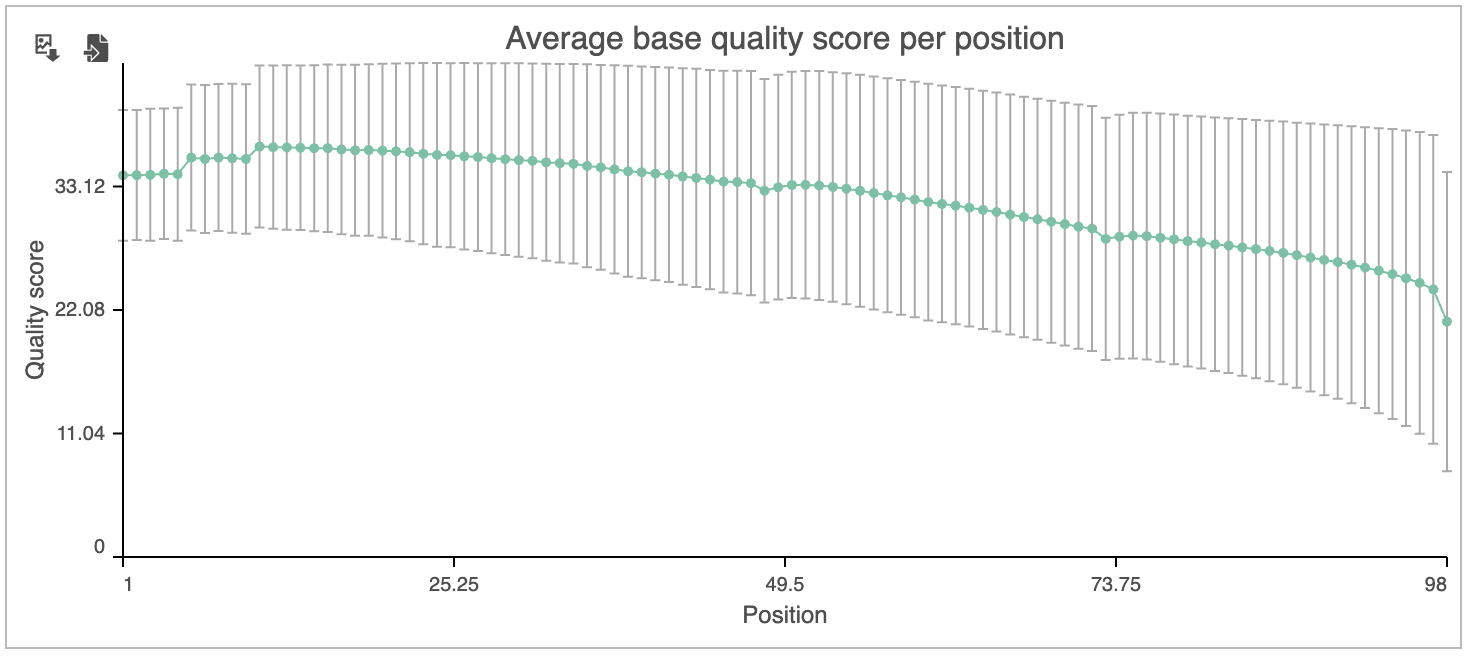
A Phred score is a measure of base call accuracy with a higher score indicating greater accuracy.
Phred Quality Score | Probability of incorrect base call | Base call accuracy |
|---|---|---|
20 | 1 in 100 | 99% |
30 | 1 in 1000 | 99.9% |
40 | 1 in 10,000 | 99.99% |
50 | 1 in 100,000 | 99.999% |
By convention, a score above 20 is considered adequate. As you can see, the standard error bars in the graph show that some reads have quality scores below 20 for some of their base pair calls near the 3' end.
...
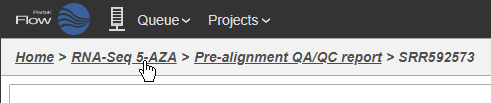
- Click RNA-Seq 5-AZA to return to the Analyses tab (Figure 7)
...
- tab
...
...
| Page Turner | ||
|---|---|---|
|
| Additional assistance |
|---|
| Rate Macro | ||
|---|---|---|
|
...
Overview
Content Tools