Page History
...
- Select E2 vs. Control from the Contrast panel of the ANOVA Streamlined tab in the List Manager dialog
- Deselect the Include size of the change option
- Set p-value with FDR < to 0.1 (Figure 2)
| Numbered figure captions | ||||
|---|---|---|---|---|
| ||||
|
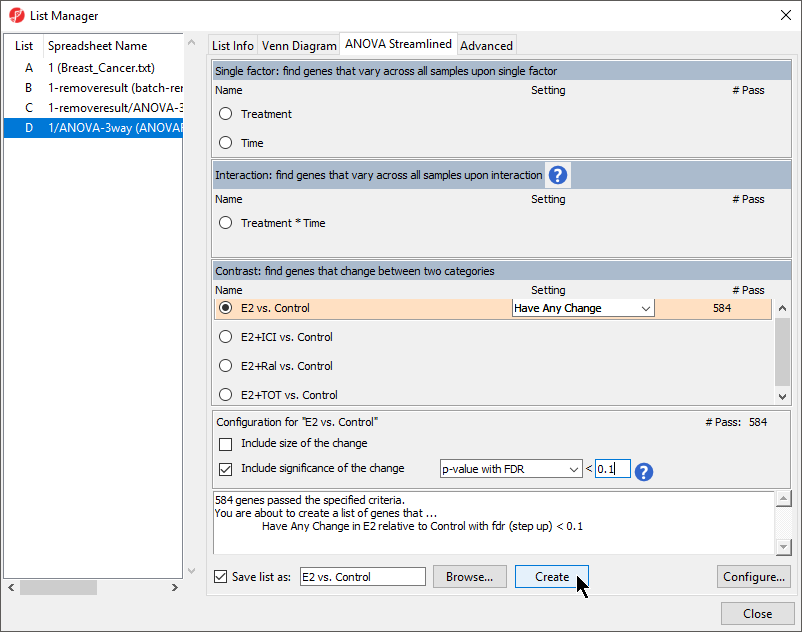
There should be ~545 probe(sets)/genes that meet this threshold.
- Select Create
A new spreadsheet, E2 vs. Control Control, will be added as a child spreadsheet of Breast_Cancer.txt.
- Repeat the steps listed above to create lists for E2for E2+ICI vs. Control (~24 genes), E2+Ral vs. Control Control (~22 genes), and E2+TOT vs. Control (~177 genes) with the same threashold
Now we can use the Venn Diagram to create a list of genes that are differentially regulated in all treatment groups.
- Select the Venn Diagram tab in the List Manager dialog
The Venn Diagram shows the amount of overlap between all selected gene lists.
- Select the four created lists (E-H) in the spreadsheet list list in the List Manager dialog by selecting each while holding the Ctrl key on your keyboard
The Venn Diagram will display the number of overlapping and distinct genes from the four lists (Figure 3).
| Numbered figure captions | ||||
|---|---|---|---|---|
| ||||
|
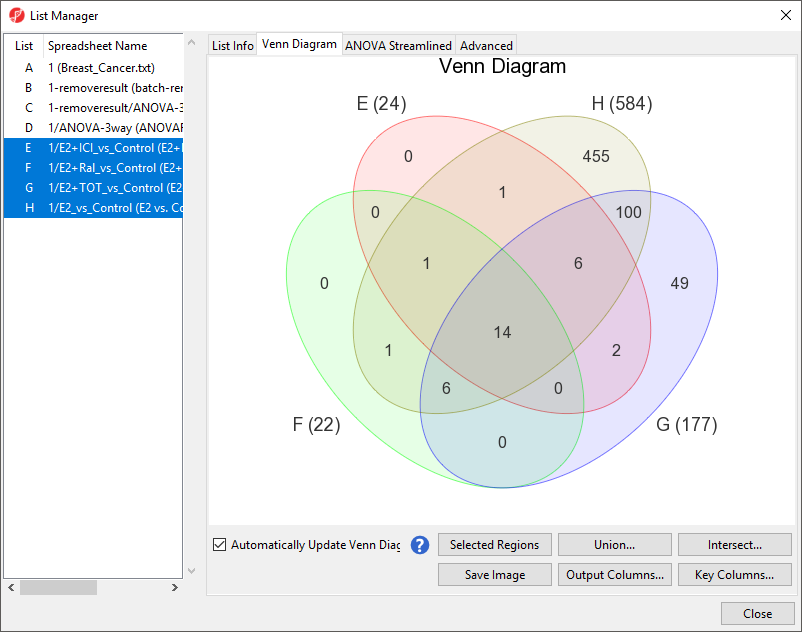
The intersection of the four ellipses shows that 14 differentially regulated genes are in common between the four threatment schemes.
- Select the region intersecting all four ellipses
- Right-click the intersected region
- Select Create List From Highlighted Regions
- Select Close to exit the List Manager dialog
...
Overview
Content Tools