Page History
...
| Numbered figure captions | ||||
|---|---|---|---|---|
| ||||
|

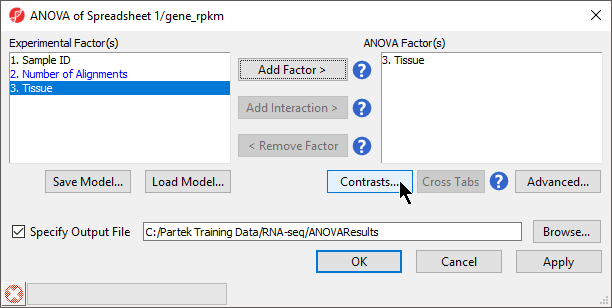
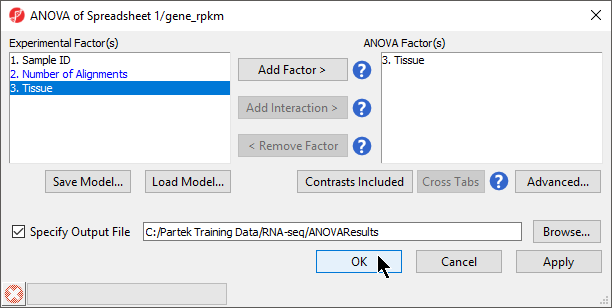
If the ANOVA were now performed (without contrasts), a p-value for differential expression would be calculated, but it would only indicate if there are differences within the factor Tissue; it would not inform you which groups are different or give any information on the magnitude of the difference between groups (fold-change or ratio). To get this more specific information, you need to define linear contrasts.
...
| Numbered figure captions | ||||
|---|---|---|---|---|
| ||||
|

...
| Numbered figure captions | ||||
|---|---|---|---|---|
| ||||
|

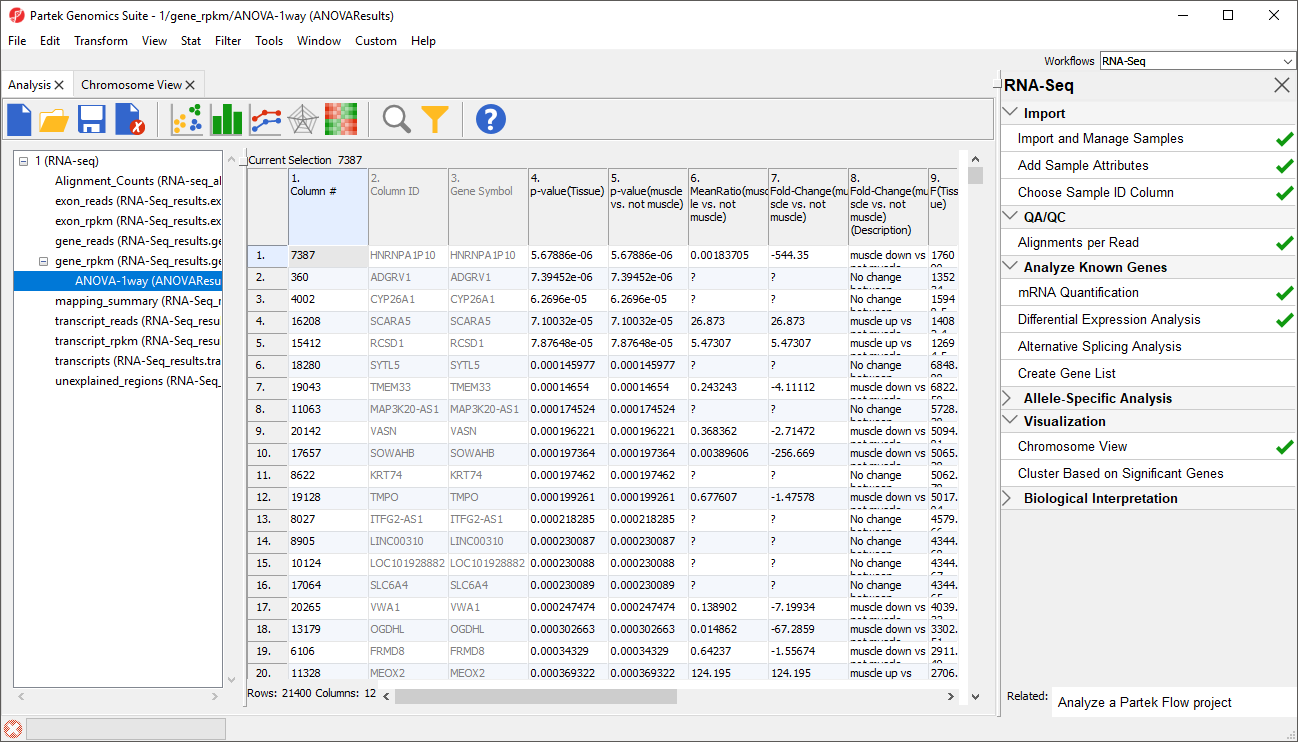
In this tutorial, the overall p-value for the factor (column 4) is the same as the p-value for the linear contrast (column 5) as there are only two levels within Tissue. If we had more than two groups, the overall p-value and the linear contrast p-values would most likely differ. You can also see the ? symbol in the ratio/fold-change columns (6 and 7) for several genes that also have a low p-value because there are zero reads in one of the groups, thus making it impossible to calculate ratios and fold-changes between groups.
...
Overview
Content Tools