Page History
...
| Numbered figure captions | ||||
|---|---|---|---|---|
| ||||
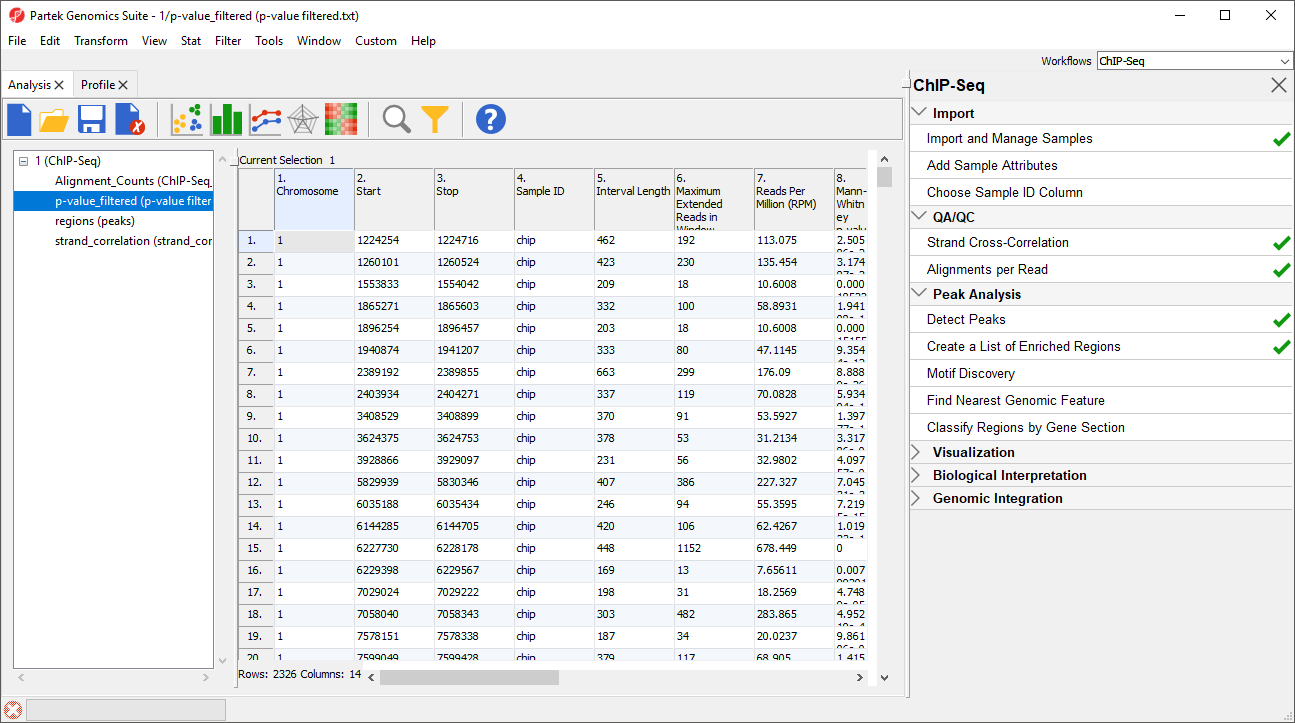
Other List Creator operations like the Venn Diagram, Union (Or), and Intersection (And) of the lists could be used to create different lists of enriched peaks. For example, you could filter on the intersection between Strand Separation FDR of 0.05 and Peaks not in mock or filter by scaled fold change or apply a minimum number of reads per million. The choice of what peaks you want to consider for downstream analysis depends on the goals and details of your experimental design.
...
Overview
Content Tools

