Join us for a webinar: The complexities of spatial multiomics unraveled
May 2
Page History
...
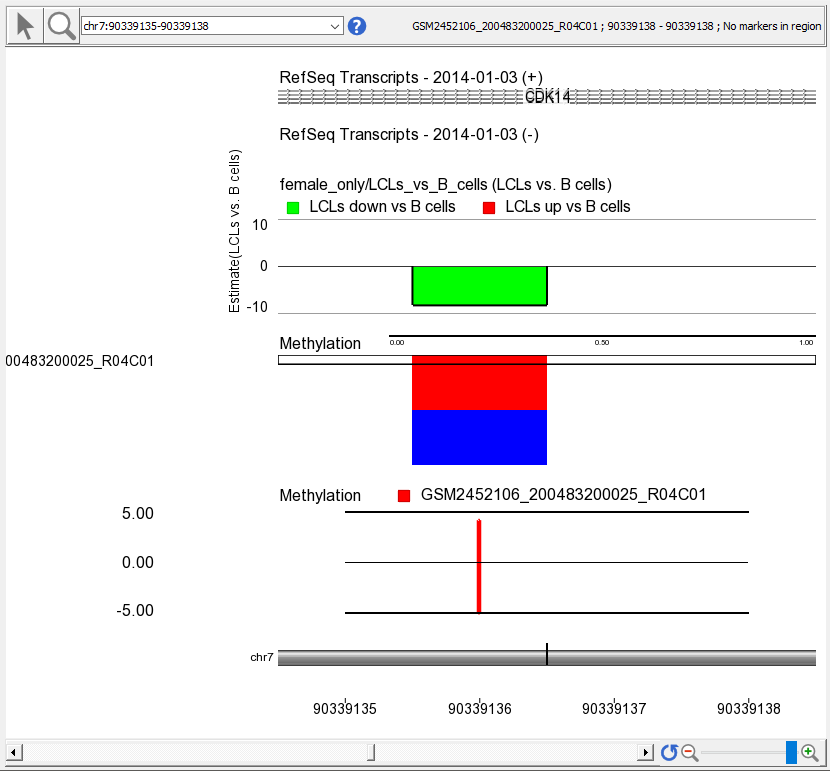
A bar indicating the M value at this probe set will appear in the Bar Chart track (Figure 3)
| Numbered figure captions | ||||
|---|---|---|---|---|
| ||||
|
...
Overview
Content Tools