Page History
...
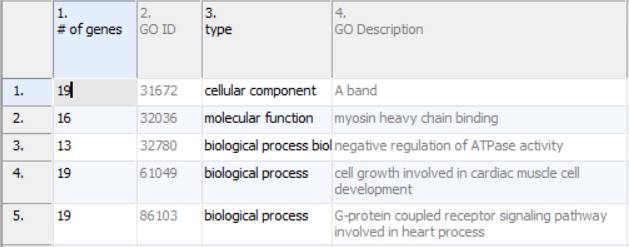
Annotations will take up the first four columns of the results sheet (Figure 1). The first column (# of genes) is the number of genes in the GO category. Specifically, this is not necessarily the number of unique genes in the category; depending on the technology, it can be the number of probes or probe sets on the microarray whose targets fall into the GO category. Genes targeted more than once will be counted more than once. The second column (GO ID) is the unique numeric identifier of the GO category; it is sometimes useful for searching with when the GO category has a very long name. The third column is the type of the GO category, while the fourth column (GO Description) is the name of the GO category.
| Numbered figure captions | ||||
|---|---|---|---|---|
| ||||
|
ANOVA Results
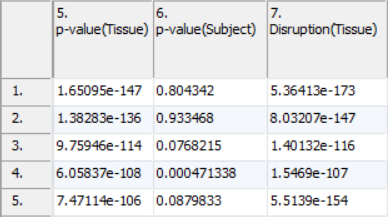
ANOVA results will include a column for each factor in the setup (Figure 2). A column with the name of the factor or interaction followed by p-value will contain how significant the effect of the variable is on the data. A lower p-value corresponds with a more significant effect. For example, a p-value of 0.1 for tissue means that given the difference between the tissue and the inherent variability of the measurements of the genes in the functional group, there is a 10% likelihood that the tissues are equivalent. A p-value of 0 occurs when the value is too small to be displayed. This can be caused by a very low estimate of inherent variability due to either a very small number of replicates or severely unbalanced data.
| Numbered figure captions | ||||
|---|---|---|---|---|
| ||||
|
| Additional assistance |
|---|
|
| Rate Macro | ||
|---|---|---|
|
Overview
Content Tools