Page History
...
This tutorial will illustrate how to:
Importing a text file list
The preferred method for importing a generic list of data into Partek Genomics Suite is as a text file.
...
| Numbered figure captions | ||||
|---|---|---|---|---|
| ||||
|
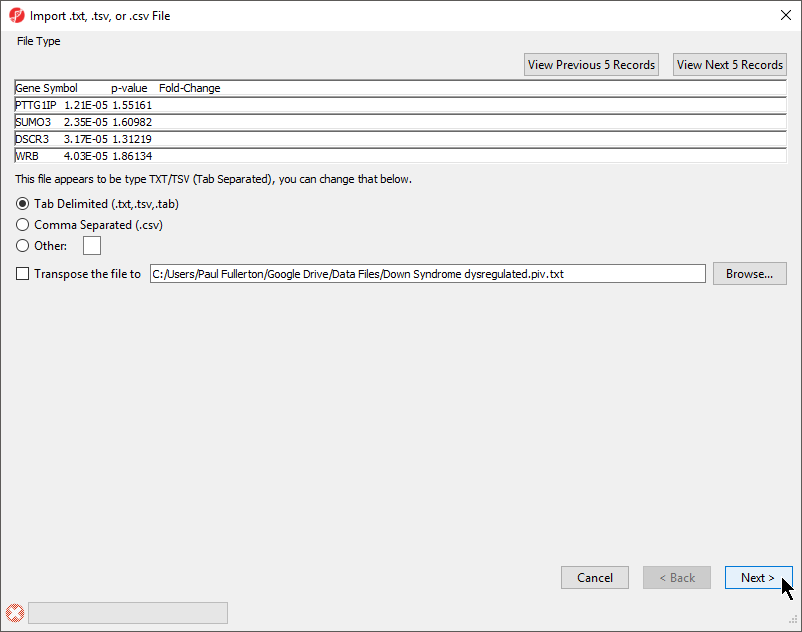
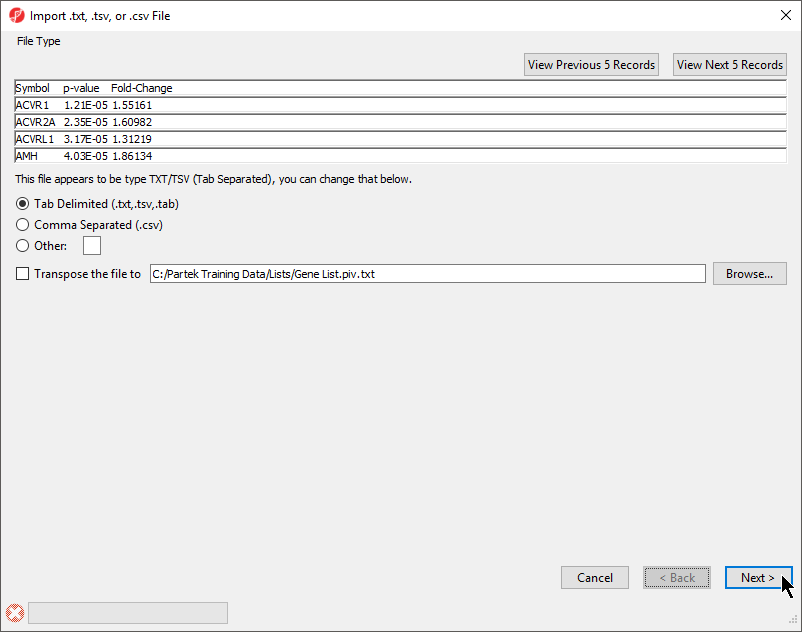
The columns in the import file can be separate by a tab, comma, or any other character.
...
| Numbered figure captions | ||||
|---|---|---|---|---|
| ||||
|

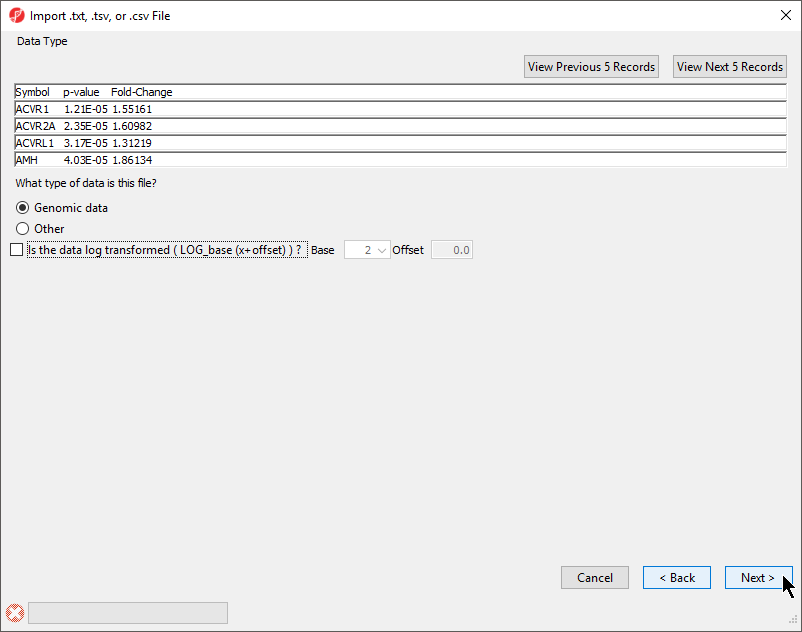
Selecting Genomic Data will result in a dialog prompt to configure genomic properties including selecting the type of genomic data, the location of genomic features in the spreadsheet, the annotation column with gene symbols, the chip or reference source and annotation file, and the species and genome build. This option should be selected if the text file contains genomic position data or other array/sequencing results.
...
| Numbered figure captions | ||||
|---|---|---|---|---|
| ||||
|
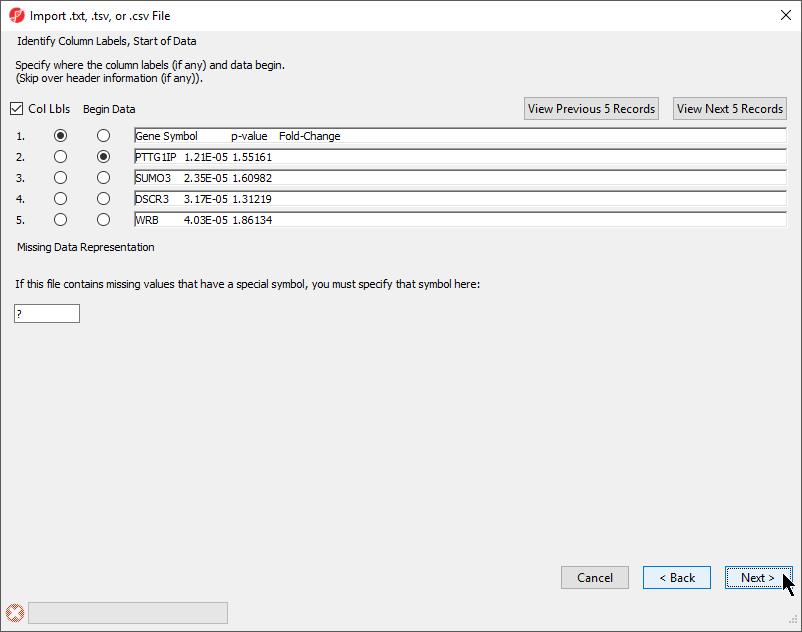
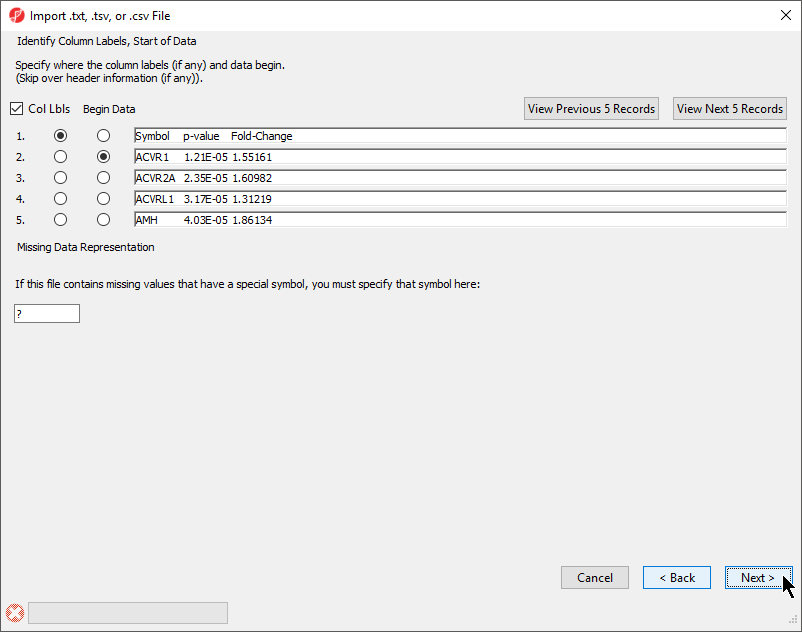
The next step is to identify where the data starts and where the optional header is found. The line that contains the header (if present) must precede the data. If there are lines to be skipped in the file (like comments), they may only appear at the top of the file, before the header line or data begin.
...
| Numbered figure captions | ||||
|---|---|---|---|---|
| ||||
|
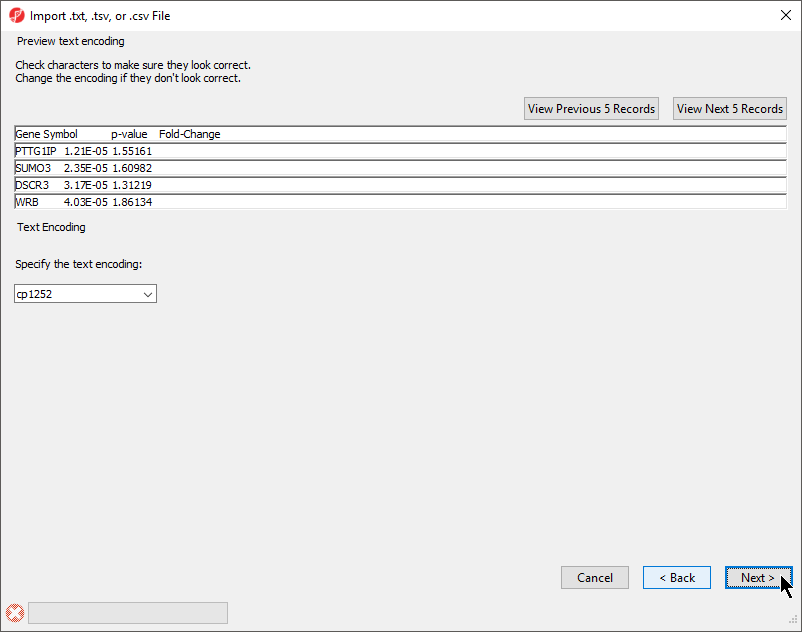
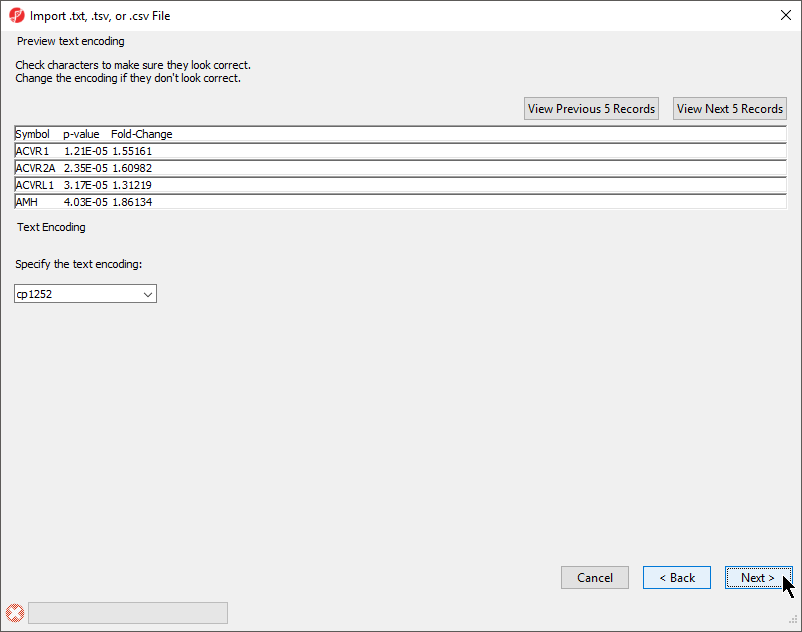
- Select Next >
...
| Numbered figure captions | ||||
|---|---|---|---|---|
| ||||
|

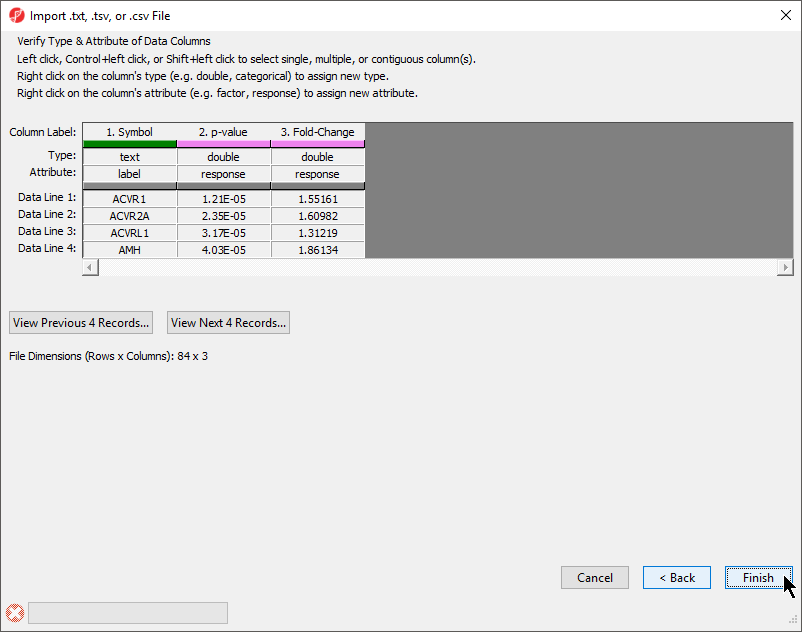
- Check and modify column types and attributes
...
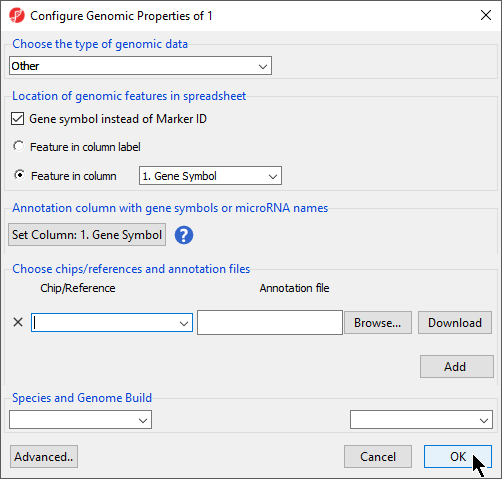
If Genomic Data was selected in the Data Type section, the Configure Genomic Properties dialog will open (Figure 6). These options will be discussed in the next section when we add an annotation file, but we will make a few selections now.
| Numbered figure captions | ||||
|---|---|---|---|---|
| ||||
|
|
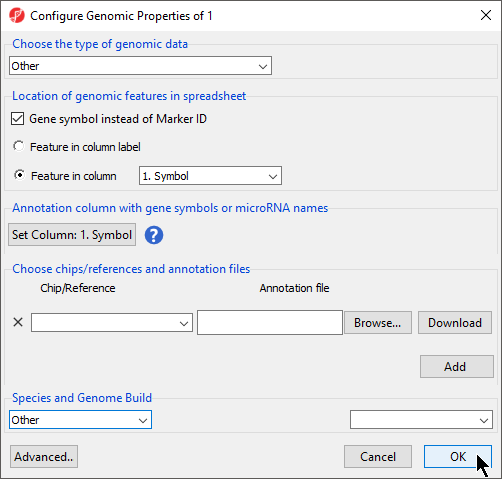
- Select Other from the Choose the type of genomic data drop-down menu
- Select Gene symbol instead of Marker ID
- Select Feature in column and choose Symbol from the drop-down menu
- Set Column 1. Symbol will be automatically selected
- Select OK
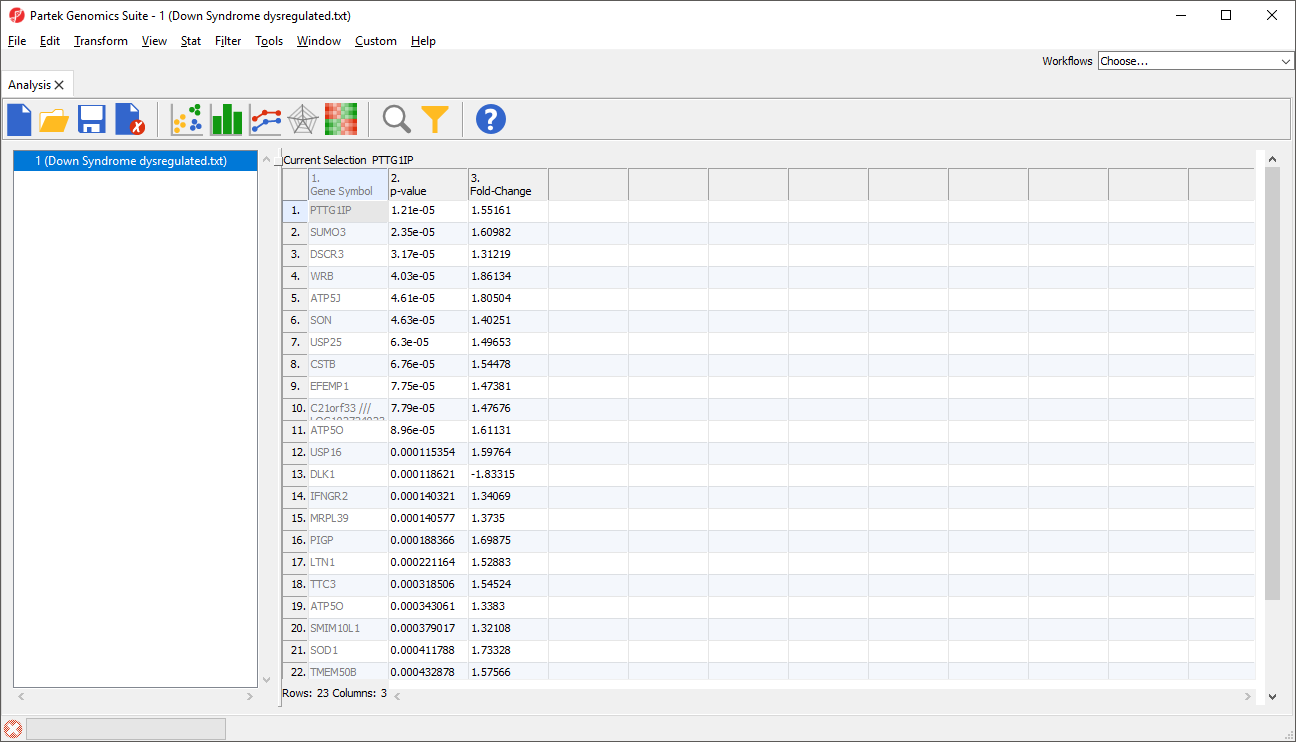
The imported spreadsheet will open (Figure 7).
| Numbered figure captions | ||||
|---|---|---|---|---|
| ||||
|
Tasks available for a list of genes
There are many useful visualizations, annotations, and biological interpretations that can operate on
a gene list. In order for these features operate on an imported list, an annotation file must first be
associated with the gene-list. Additionally, many operations that work with a list of significant genes
(like GO- or Pathway-Enrichment) require comparison against a background of “non-significant”
genes.
Adding an annotation file
The quickest way to accomplish both is to use the background of “all genes” for that organism
provided by an annotation source like RefSeq, Ensembl, etc. in .pannot (Partek® annotation), .gff, .gtf,
.bed, tab- or comma-delimited format. If the file is not already in a tab-separated or comma delimited
format, you may import, modify, and save the file in the proper file format.
- Select File from the main toolbar
- Select Genomic Database under Import
- Select the annotation file; we have selected hg19_refseq_14_01_03_v2.pannot from the C:/Microarry Libraries folder
- Delete or rearrange the columns as necessary; we have placed the column with identifiers that correspond to our gene list first
- Select (
 ) to save the annotation file; we have named it Annotation File
 - Select (
 ) to close the annotation file
Now we can add the annotation file to our imported gene list.
- Right click 1 (Gene List.txt) in the spreadsheet tree
- Select Properties from the pop-up menu
This is the Configure Genomic Properties dialog we saw earlier (Figure 6).
- Select Browse under Annotation File
- Choose the annotation file; we have chosen Annotation File.txt
- Select appropriate species and genome build options; we have selected Homo sapiens and hg19
- Select OK
Adding annotations
Inserting annotations from an annotation file
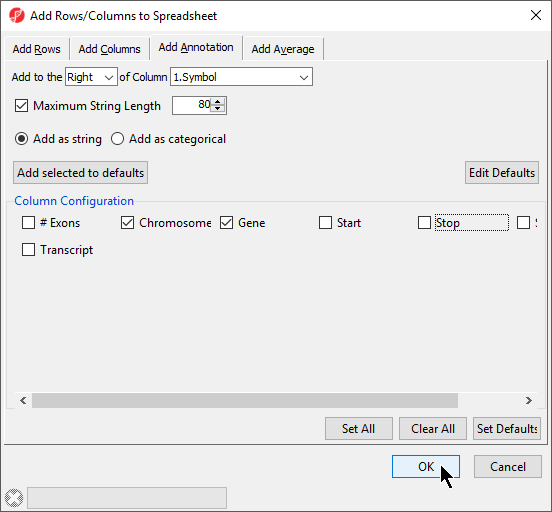
If a genomic annotation file has been added, annotations from the file can be added as columns in the spreadsheet.
- Right click on a column header
- Select Insert Annotation
- Select columns to add from Column Configuration (Figure 8)
- Select OK
| Numbered figure captions | ||||
|---|---|---|---|---|
| ||||
|
Annotating with cytobands
- Select Annotate with Cytobands from Tools in the main toolbar when a suitable spreadsheet is open
A column with cytoband locations will be added to the spreadsheet. Adding a cytoband is possible if genomic coordinates are associated with the gene list spreadsheet during import or by association with an annotation file.
Annotating with known SNPs
- Select Annotate with Known SNPs from Tools in the main toolbar when a suitable spreadsheet is open will add
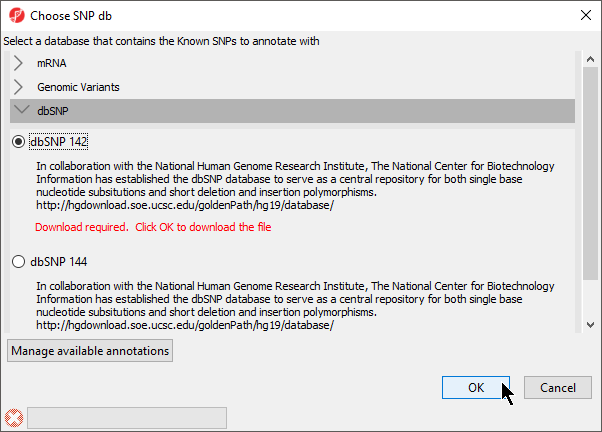
A column of SNPs associated the listed genes and a column indicating the number of SNPs known to be associated with the genes will be added to the spreadsheet. If a SNP database has not been previously downloaded, it will need to be downloaded through the SNP database dialog (Figure 9).
| Numbered figure captions | ||||
|---|---|---|---|---|
| ||||
|
Alternatively, to generate a list of SNP IDs per row, right-click on a row header and select Create list of dbSNP.
In addition to SNPs, this feature can associate any data with a list of genes or genomic coordinates; the dbSNP database, any miRNA database, data from the Database of Genomic Variants (dgv), any mRNA transcriptome database, or any custom annotation source can be associated with your list. In each case, this feature will add columns to the imported gene list spreadsheet that correlate the genes with the features from those databases.
GO Enrichment
The Gene Ontology (GO) Enrichment p-value calculation uses either a Chi-Square or Fisher’s Exact test to compare the genes included in the significant gene list to all possible genes present in the experiment or the background genes. For a microarray experiment, background genes consists of all genes on the chip/array; for a next generation sequencing experiment, all genes in the species transcriptome are considered background genes.
Because the calculation is essentially comparing overlapping sets of genes and does not use intensity values, GO Enrichment can be performed on an imported gene list. GO Enrichment is available through the Gene Expression workflow.
If no annotation file has been specified for the gene list, GO Enrichment will use the full species transcriptome as the background genes. While suitable for next generation sequencing experiments, for microarray experiments, only the genes on the chip/array are appropriate. Please contact our technical support department for assistance with this step if needed.
Pathway Enrichment
Like GO Enrichment, Pathway Enrichment does not require numerical values but operates on lists of genes - a list of significant genes vs. background genes. Consequently, Pathway Enrichment may be used with an imported list of genes. The list of background genes is set to the species transcriptome by default, but can be set to a specific set of genes if the gene list has been associated with an annotation file.
Tasks available for a gene list with numeric data
All the operations available for a gene list are available; you may also use the numeric data associated with the genes for visualization, clustering, and statistical operations.
Descriptive Statistics
There are numerous descriptive statistics available in Partek Genomics Suite. Selecting Stat in the main toolbar then either Descriptive or Correlate will show available options. Principal Component Analysis is available by selecting Tools then Discover from the main toolbar.
Applying Multiple Test Correction
If your imported data contains a list of p-values, you may use any of the available multiple test corrections by by selecting Stat then Multiple Test then Multiple Test Corrections from the main toolbar. .
Plotting numeric data associated with a gene list
To see a profile plot of numerical data associated with your imported gene list, select View then Profiles or any of the other available View options form the main toolbar.
Genome Browser
If you have imported numerical data associated with genes (like p-values or fold-changes), you can visualize these values in the Genome Browser once an annotation file has been added.
- Right-click on a row header in the imported gene list spreadsheet
- Select Browse to location
If the annotations have been configured properly, you should see a track for the first column of numerical data, a cytoband track, and an annotation track. You can also add another track to display a second column of numerical data.
- Select New Track
- Select Add a track from spreadsheet
- Select Next >
A new track will be added.
- Select the track in the track preferences panel to edit it
- Select the other numerical column in the Bar height by drop-down menu
Clustering
If the data is suitable for clustering, access the clustering function through the toolbar, not form a workflow. The workflow implementation assumes the data to be clustered are found on a parent spreadsheet and the list of genes is in a child spreadsheet. Because the data to be clustered is all on one spreadsheet, select Tools from the main toolbar then Discover then Hierarchical Clustering.
| Additional assistance |
|---|
|
| Rate Macro | ||
|---|---|---|
|
Overview
Content Tools