Join us for a webinar: The complexities of spatial multiomics unraveled
May 2
Page History
| Table of Contents | ||||||
|---|---|---|---|---|---|---|
|
What is Hierarchical Clustering?
Hierarchical clustering is used to group groups similar objects into “clusters”. In the beginningclusters. To start, each row and/or column is considered a cluster. In hierarchical clustering, the The two most similar clusters are then combined and continue to combine this process is iterated until all objects are in the same cluster. Hierarchical clustering produces Hierarchical clustering displays the resulting hierarchy of the clusters in a tree ( called a dendogram) that shows the hierarchy of the clusters. This allows . Hierarchical clustering is useful for exploratory analysis to see how the microarrays because it shows how samples group together based on similarity of features. Hierarchical
Hierarchical clustering is considered an unsupervised clustering method. Unsupervised Unsupervised clustering does methods do not take any of the the identity or attributes of samples into account when clustering. This means that any experimental variables such as treatment, phenotype, tissue, etc. into account while clustering, whereas supervised clusters does number of expected groups, etc. do not guide or bias cluster building. Alternatively, supervised clustering methods do consider experimental variables when clustering. Partek offers an alternative building clusters.
Partek Genomics Suite offers two alternatives to Hierarchical clustering in the form of - K-Means clustering and Self-Organizing Map. You can read For a more in-depth description of how Partek Genomics Suite performs these different forms for of clustering analysis in , please see Chapter 8 Hierarchical & Partitioning Clustering of the Partek Manual. The Partek user’s manual is embedded in Manual can be accessed through Partek Genomics Suite under Help > On-Line Help.
Hierarchical Clustering in Action
To illustrate the capabilities and customization options of hierarchical clustering in Partek Genomics Suite, we will explore an example of hierarchical clustering drawn from the tutorial Gene Expression Analysis. The data set in this tutorial includes gene expression data from patients with or without Down syndrome. Using this data set, 23 highly differentially expressed genes between Down syndrome and normal patient tissues were identified. These 23 differentially regulated genes were then used to perform hierarchical clustering of the samples. Follow the steps outlined in Hierarchical Clustering and Adding Information to Gene Lists to perform hierarchical clustering and launch the Hierarchical Clustering tab (Figure 1).
| Numbered figure captions | ||||
|---|---|---|---|---|
| ||||
|
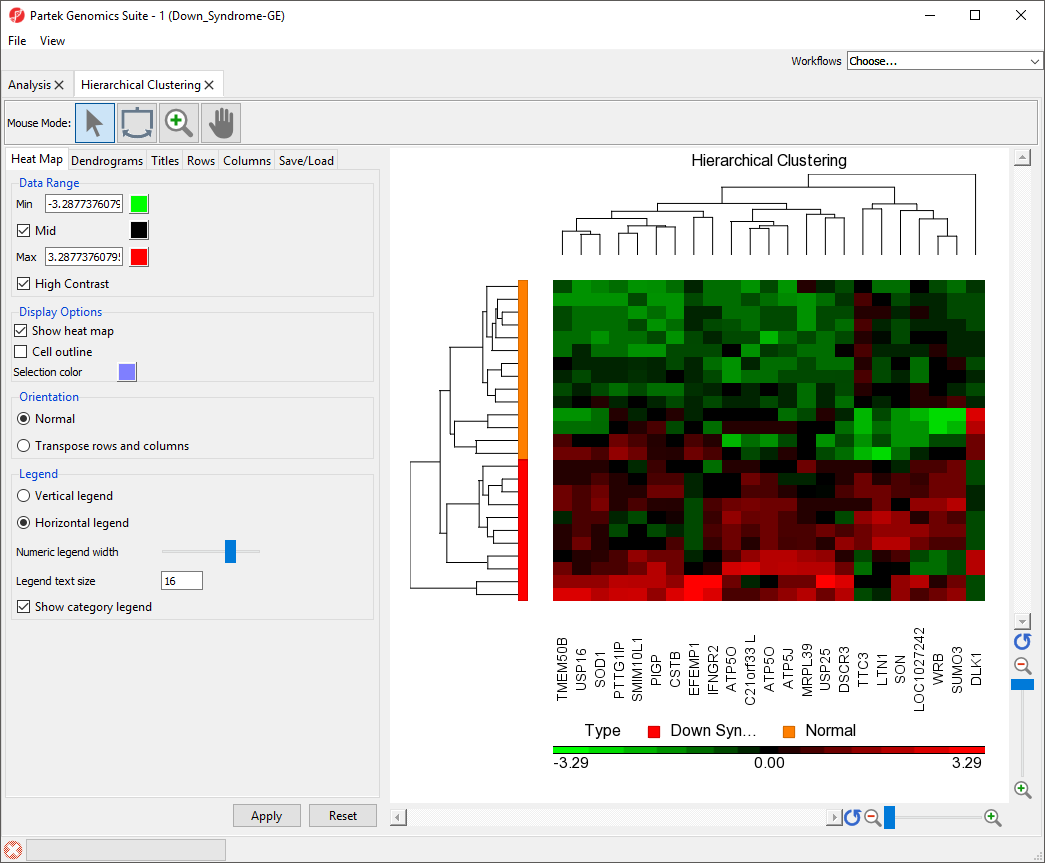
The right-hand section of the Hierarchical Clustering tab is a heatmap showing relative expression of the genes in the list used to perform clustering. The heatmap can be configured using the properties panel on the left-hand side of the tab. By default, down-regulated genes will be shown in green, genes with no change in expression will be shown in black, and up-regulated genes will be shown in red. The dendograms on the left-hand side and top of the heatmap show clustering of samples as rows and features (probes/genes in this example) as columns.
| Additional assistance |
|---|
|
| Rate Macro | ||
|---|---|---|
|
Overview
Content Tools