Page History
...
How you proceed depends on your study design. Here is an example series of steps to prepare the tutorial data set for copy number analysis:
- Select Probe Intensity and Select Probe Intensity and Antilog Probe Intensity Values (Figure 2)
- Select OK to close the Advanced Import Options dialog
- Select Import to import the data and perform the selected normalization method
- Select the (_probe) spreadsheet from the spreadsheet tree
- Delete any samples with _detectionp names
- Create sample attributes, assign samples to the groups, and filter as described in Annotating Annotate and Filter Samples
- Select Transform from the main toolbar
- Select Normalize to baseline
...
- Select Use control set form this spreadsheet
- Set Control Category to B cells
- Select Ratio to baseline from the Normalization Method section
- Select After ratio apply log base 2
- Select New Spreadsheet from the Configure Output section
| Numbered figure captions | ||||
|---|---|---|---|---|
| ||||
|
|
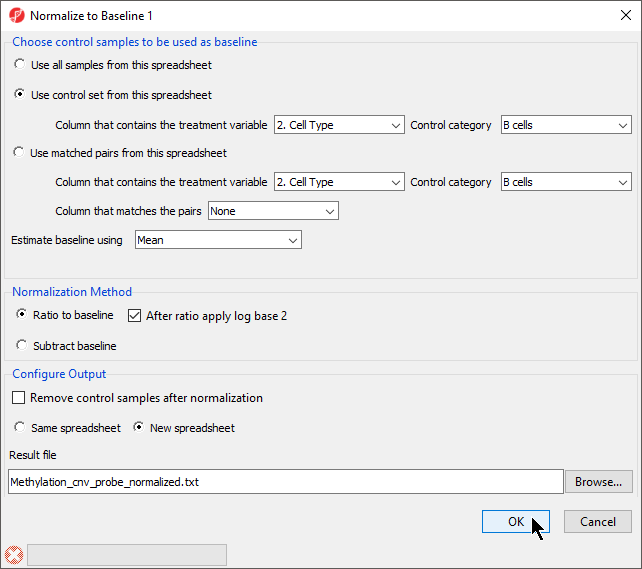
- Select OK to generate the spreadsheet
This spreadsheet contains copy number values per probe in log2 space (i.e. diploid = 0). This spreadsheet is the starting spreadsheet for copy number analysis. You can now switch over to the Copy number workflow, skip the Create copy number step, and begin with the Detect amplifications and deletions step. Consult the user's guide for the copy number workflow for subsequent steps.
References:
Feber A, Guilhamon P, Lechner M, et al. Using high-density DNA methylation arrays to profile copy number alterations. Genome Biology. 2014;15(2):R30. doi:10.1186/gb-2014-15-2-r30.
| Additional assistance |
|---|
|
| Rate Macro | ||
|---|---|---|
|
Overview
Content Tools