Page History
...
An alternative could be to first summarize all the probes belonging to a CpG island region (i.e. island, N-shore, N-shelf, S-shore, S-shelf) and then use ANOVA to compare regions across the groups. Since the summarization will include both type I and type II probes, you may want to split the analysis in two branches and analyze type I and type II probes independently. To do this, we need to annotate each probe as type I or type II.
- Select the female_only the mvalue spreadsheet
- Select Transform from the main toolbar
- Select Create Transposed Spreadsheet... from the Transform drop-down menu (Figure 1)
| Numbered figure captions | ||||
|---|---|---|---|---|
| ||||
|


- Select Sample ID for Column: and numeric for Data Type:
- Select OK
...
| Numbered figure captions | ||||
|---|---|---|---|---|
| ||||
|
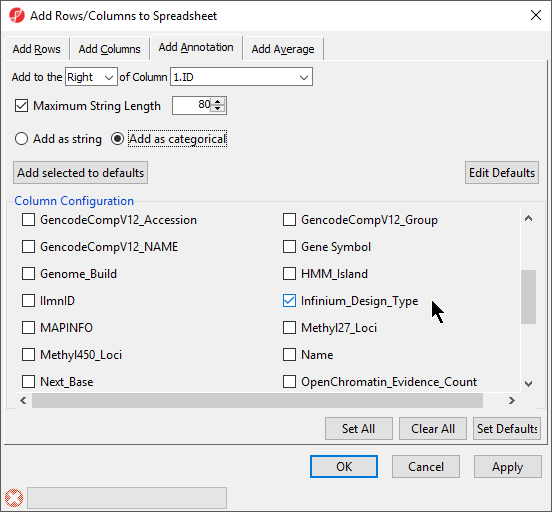
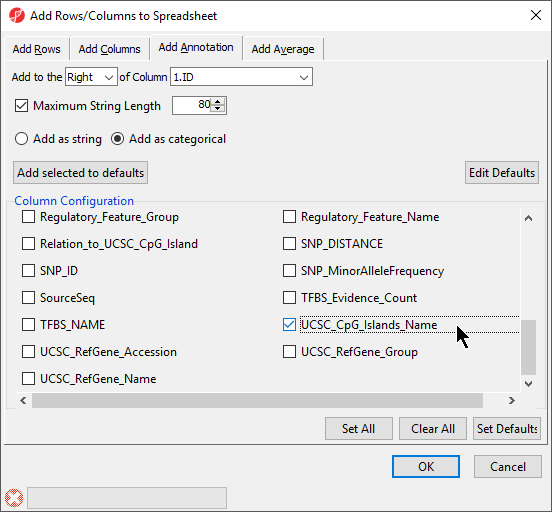
- Select OK to add the Inifinium design type and UCSC CpG island name as categorical columns on the spreadsheet
...
| Numbered figure captions | ||||
|---|---|---|---|---|
| ||||
|
- Name the new spreadsheet female_only_typeII_probes
- Select OK
- Save the created spreadsheet, we chose the file name female_only_typeII_probes
- Repeat process to create a spreadsheet for type I probes
...
| Numbered figure captions | ||||
|---|---|---|---|---|
| ||||
|
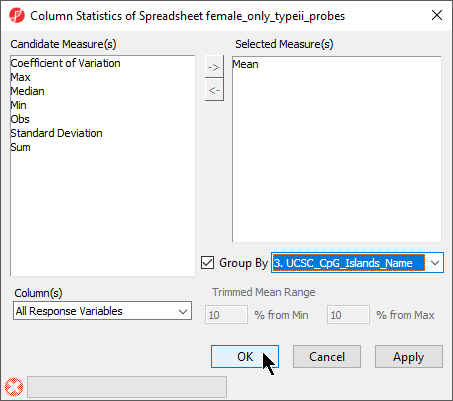
- Add Mean to the Selected Measure(s) panel
- Select Group By and set it to 3. UCSC_CpG_Islands_Name (Figure 5)
| Numbered figure captions | ||||
|---|---|---|---|---|
| ||||
|
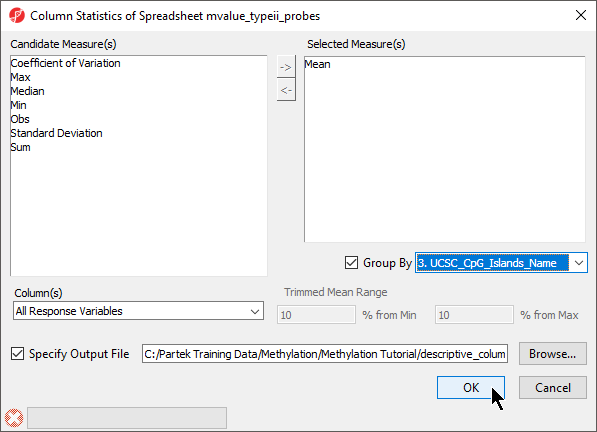
- Select OK
The new temporary spreadsheet has one CpG island region per row (Figure 6), samples on columns, and the values in the cells represent the mean of M values of all the CpG probes in the region.
...
| Numbered figure captions | ||||
|---|---|---|---|---|
| ||||
|
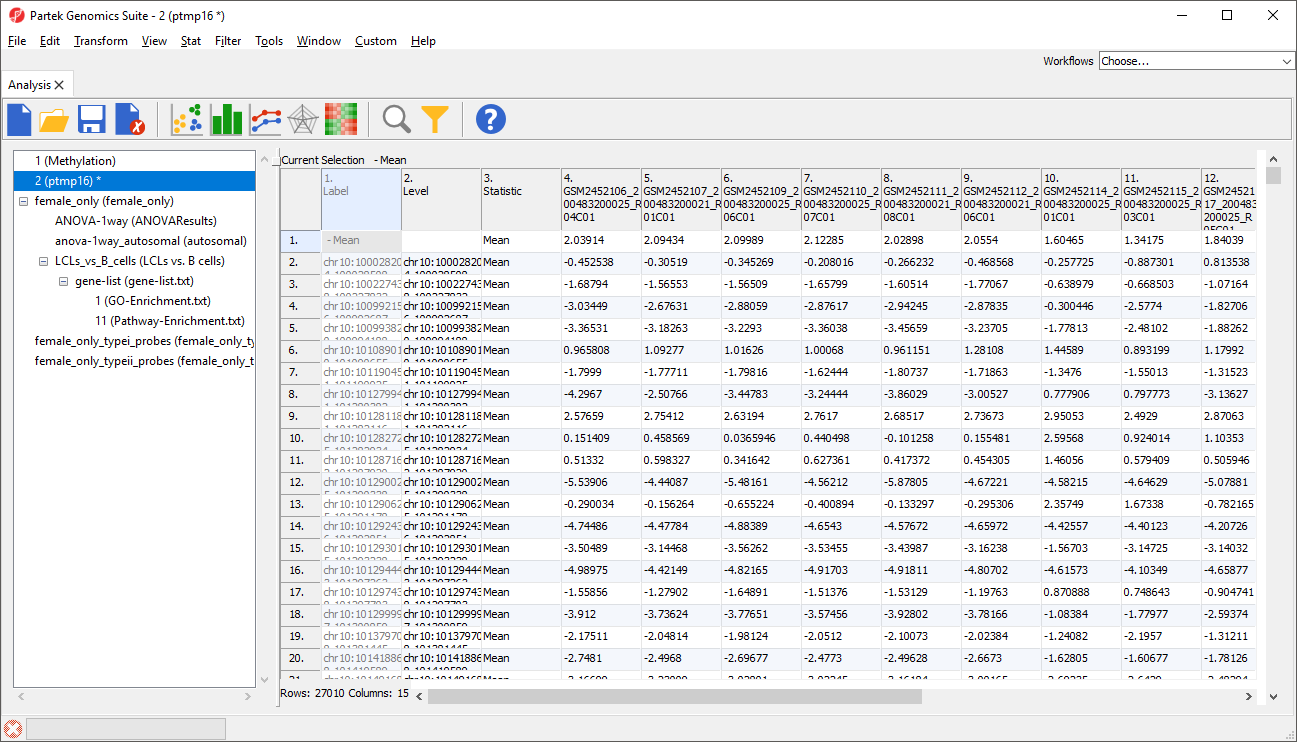
Note the first row, with label “– Mean”. It corresponds to all the probes that map outside of UCSC CpG islands. As it is not needed for the downstream analysis, we will remove it.
...
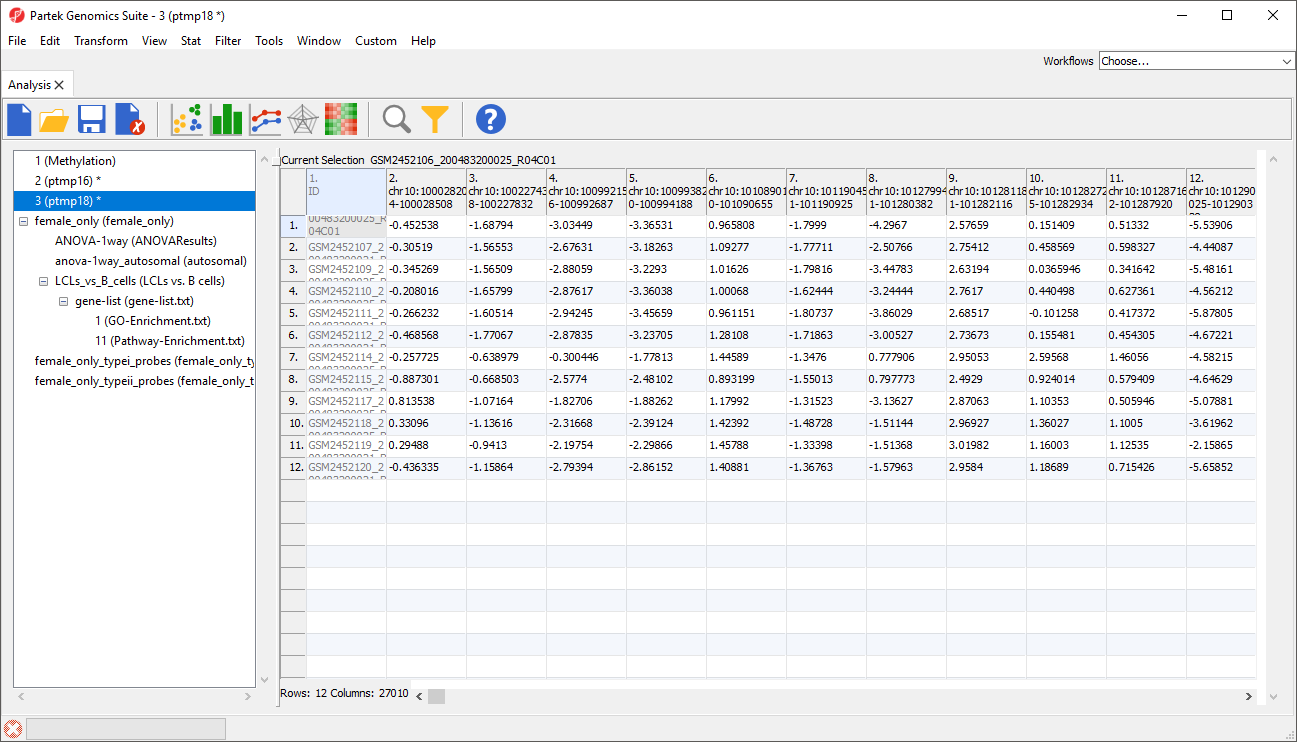
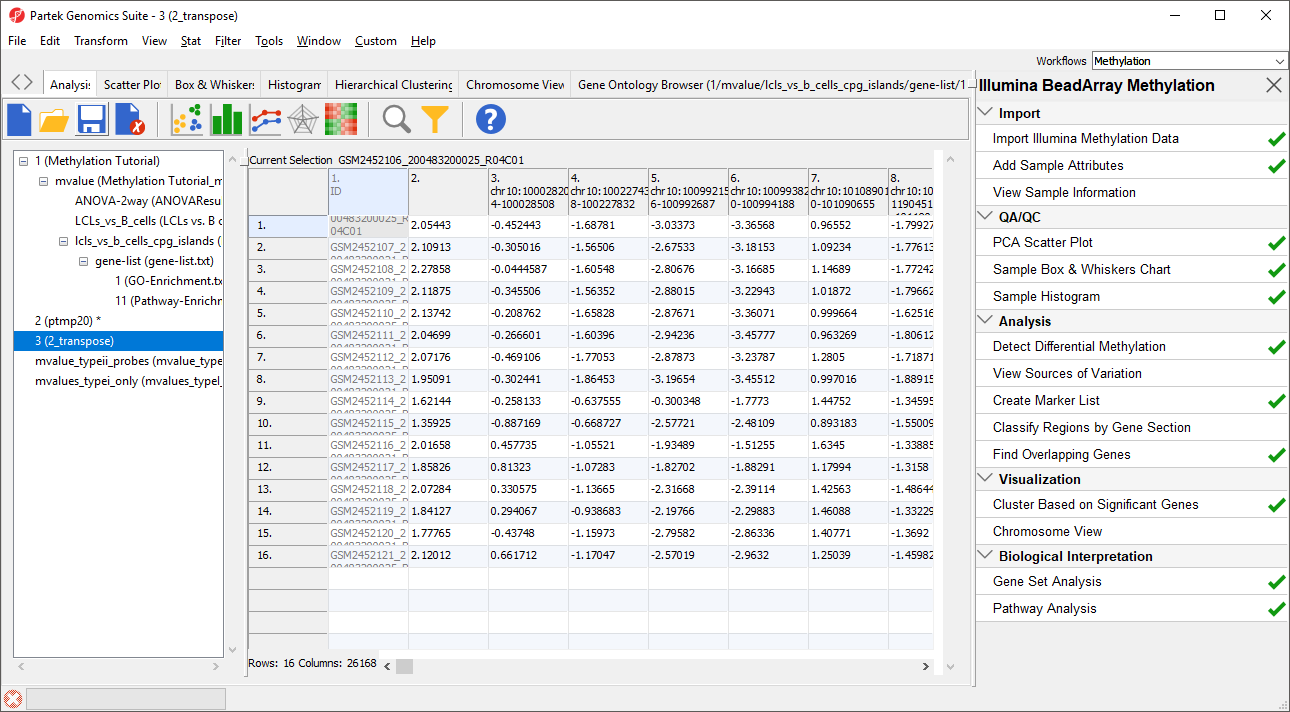
The layout of the new transposed spreadsheet is as follows: one sample per row with CpG island regions on columns; cell entries correspond to mean methylation status of the region (Figure 7). The column with a blank value for the column header is the average of all probes not associated with CpG island regions. You can delete this column if you like.
| Numbered figure captions | ||||
|---|---|---|---|---|
| ||||
|
...
|
- Right-click the transposed spreadsheet as female_only, 2_transpose
- Select Save as... from the pop-up menu
- Name it mvalues_typeII_probes_CpG_islands
- Close the source temporary spreadsheet by selecting it in the spreadsheet tree and selecting (
 )
)
This spreadsheet can then The mvalues_typeII_probes_CpG_islands spreadsheet can be used as a starting point for ANOVA and other analyses. You can also repeat the steps above to create an equivalent spreadsheet for type I probes.
| Page Turner | ||
|---|---|---|
|
...
Overview
Content Tools