Join us for a webinar: The complexities of spatial multiomics unraveled
May 2
Page History
...
| Numbered figure captions | ||||
|---|---|---|---|---|
| ||||
|
| Numbered figure captions | ||||
|---|---|---|---|---|
| ||||
|
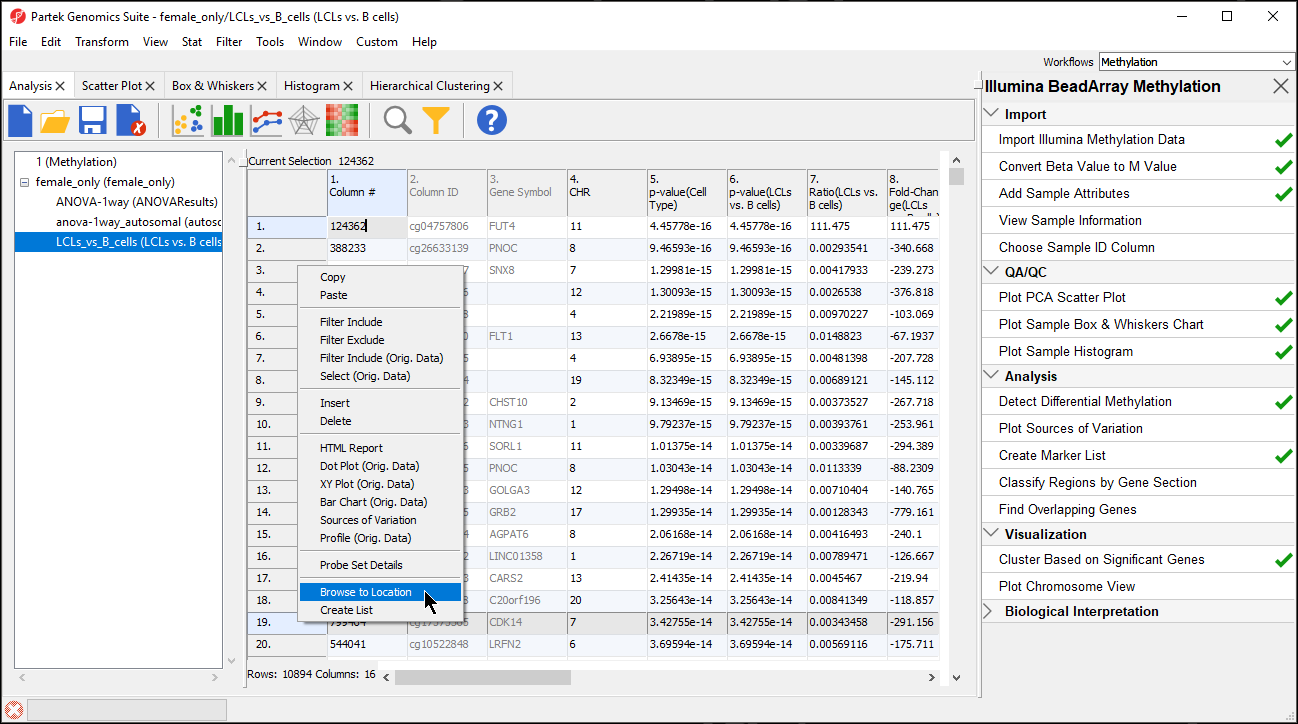
- RefSeq Transcripts 2014-01-03 (hg19) (+): transcripts coded by the positive strand
- RefSeq Transcripts 2014-01-03 (hg19) (-): transcripts coded by the negative strand
- Regions: by default, fold-change difference in methylation between the groups
- Heatmap: M values for all the samples
- Barchart: methylation levels of the selected sample (to select a sample, click on a heat map)
- Cytoband: cytobands of the current chromosome
- Genomic Label: coordinates on the current chromosome
To modify a track, select it in the Tracks panel to bring up its configuration options panel below the Tracks panel. Let's modify a few tracks to improve our visualization of the data.
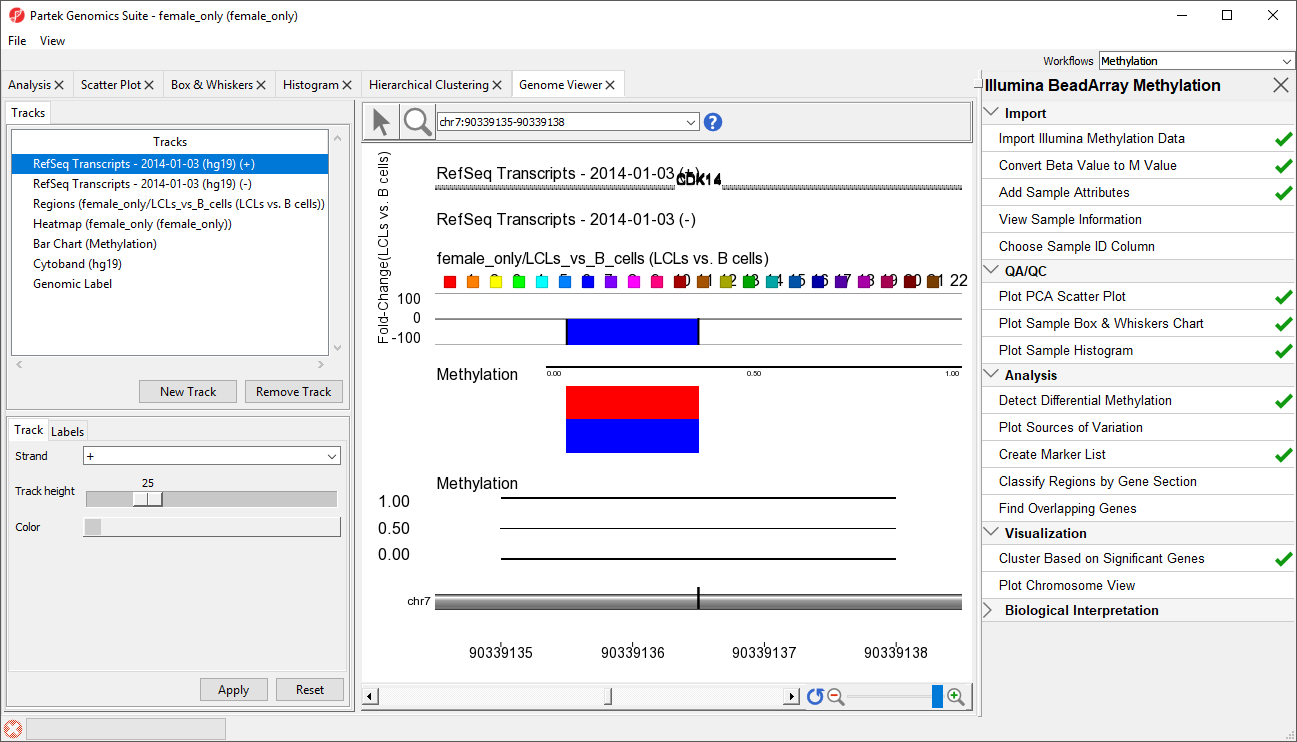
- Select the Regions track, opens to Profile tab
- Set Bar height by to Estimate
- Set Min and Max to -10 and 10
- Select Apply to change
- Select Color tab
- Set Color bars by to Fold Change (LCLs vs. B cells) (Description)
- Select Apply to change
This will allow us to visualize the differences in methylation between the two groups.
- Select the Bar Chart track, opens to Y-axis tab
- Set Min and Max to -5 and 5
- Select Apply to change
- Select a sample to display in the Bar Charttrack by left-clicking on a row in the heat map
A bar indicating the M value at this probe set will appear in the Bar Chart track (Figure 3)
| Numbered figure captions | ||||
|---|---|---|---|---|
| ||||
|
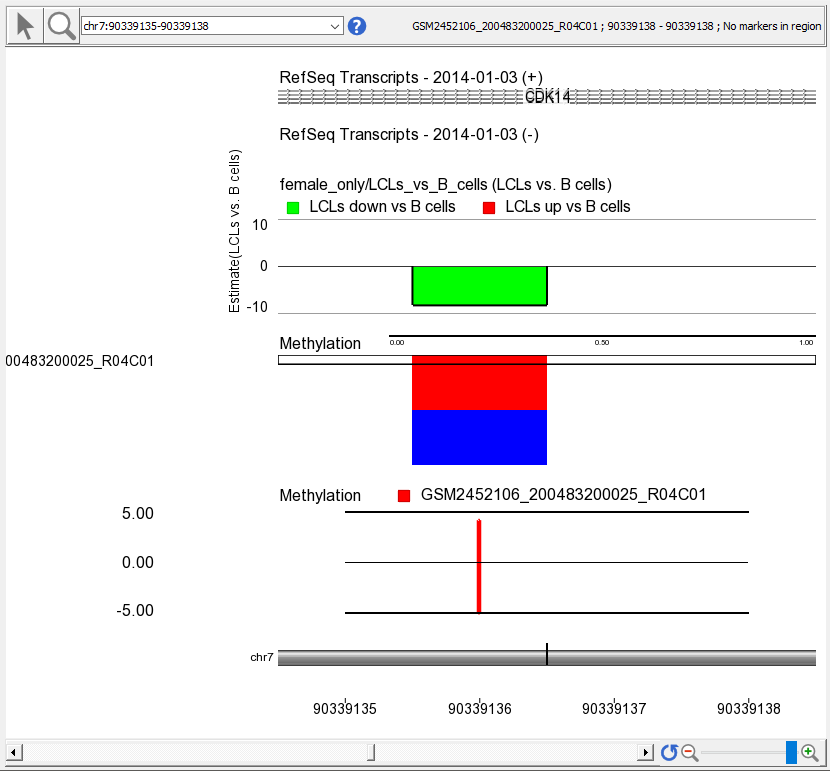
 ). View can be reset to the whole chromosome level using reset zoom (
The available tracks can be supplemented with a special annotation file which that can be built using a UCSC annotation file as the basis. Building and viewing the UCSC annotation file is available as an optional section of the tutorial, Optional: Adding UCSC CpG Island Annotations.
| Page Turner | ||
|---|---|---|
|
| Additional assistance |
|---|
|
| Rate Macro | ||
|---|---|---|
|
Overview
Content Tools