Page History
...
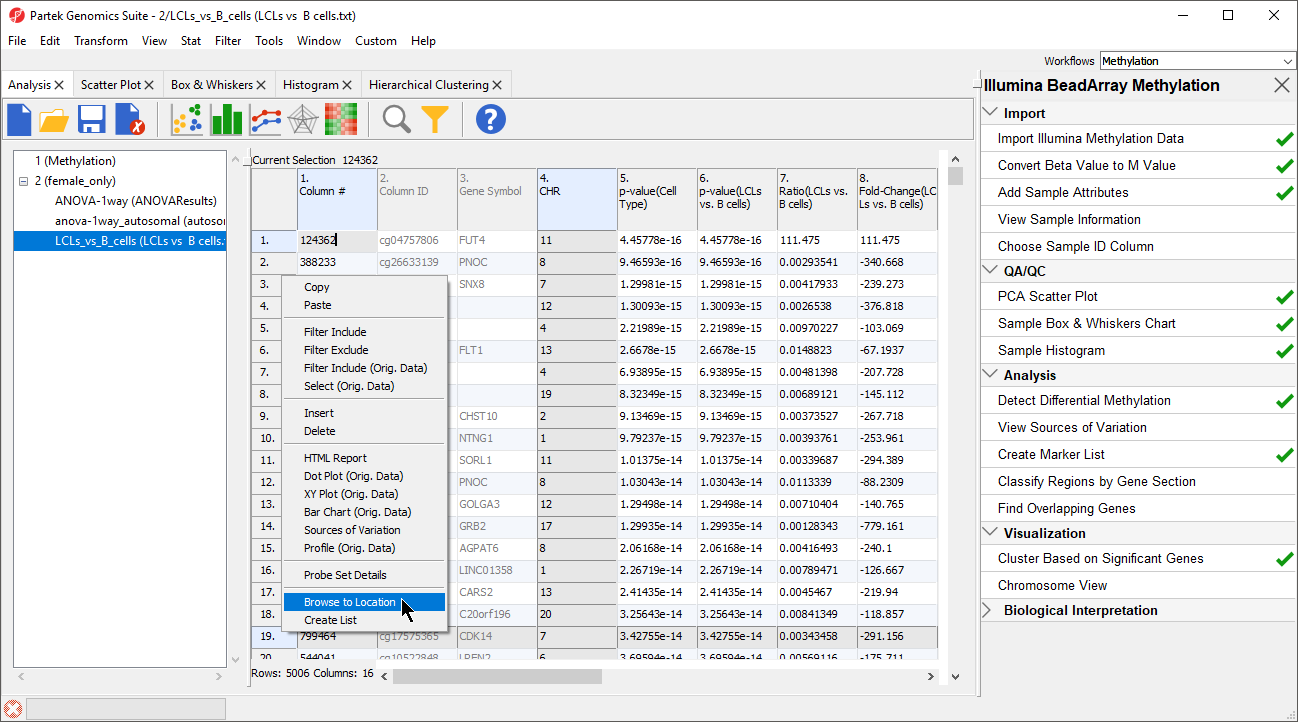
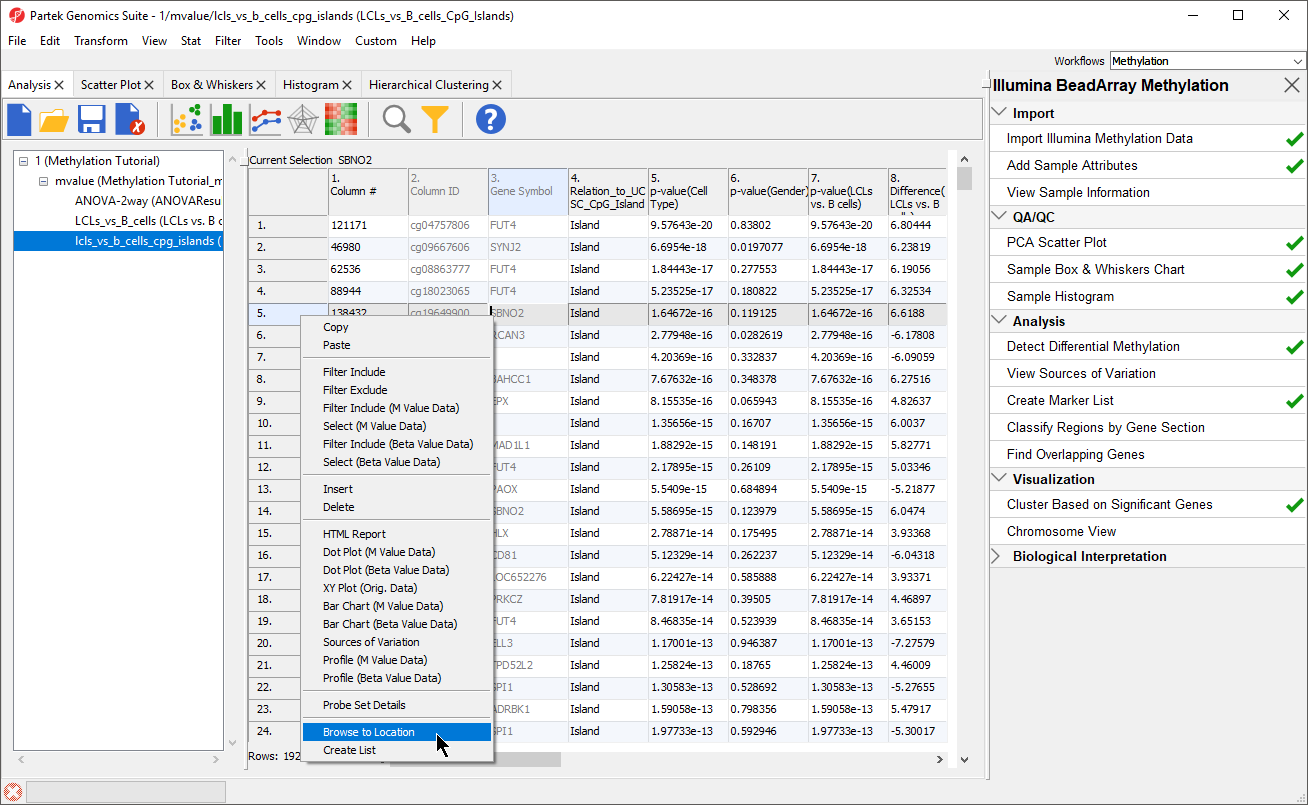
Partek Genomics Suite enables you to visualize each probe and compare the methylation between the groups at a single CpG site level.
- Right click row 195. Cdk14SBNO2 in the LCLs_vs B cells _B_Cells_CpG_Islands spreadsheet
- Select Browse to Location from the pop-up menu
| Numbered figure captions | ||||
|---|---|---|---|---|
| ||||
|
| Numbered figure captions | ||||
|---|---|---|---|---|
| ||||
|
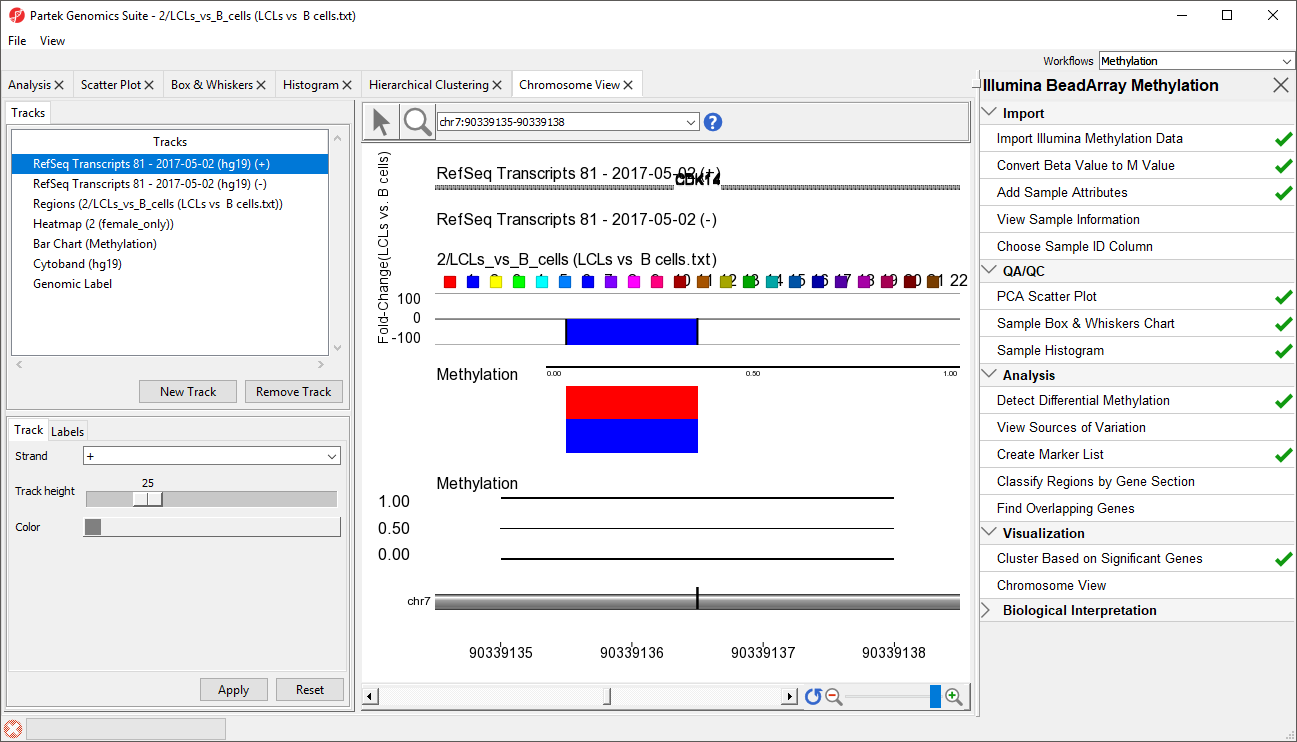
- RefSeq Transcripts 2017-05-02 (hg19) (+): transcripts coded by the positive strand
- RefSeq Transcripts 2017-05-02 (hg19) (-): transcripts coded by the negative strand
- Regions: by default, fold-change difference in methylation (M-value) between the groups
- Heatmap (1/mvalue): M values for all the samples
- Barchart (Methylation): methylation levels level in M value of the selected sample (to select a sample, click on a heat map)
- Heatmap (Methylation Tutorial): Beta values for all the samples
- Barchart (Methylation): methylation level in Beta value of the selected sample (to select a sample, click on a heat map)
- Cytoband: cytobands of the current chromosome
- Genomic Label: coordinates on the current chromosome
...
- Select the Regions track, opens to Profile tab
- Set Bar height by to Estimate
- Set Min and Max to -10 and 10
- Select Apply to changeSelect Color tab
- Set Color bars by to Fold Change Difference (LCLs vs. B cells) (Description)
- Select Apply to change
This will allow us to visualize the differences in methylation between the two groups.
- Select the Bar Chart track, opens to Y-axis tab
- Set Min and Max to -5 and 5
- Select Apply to change
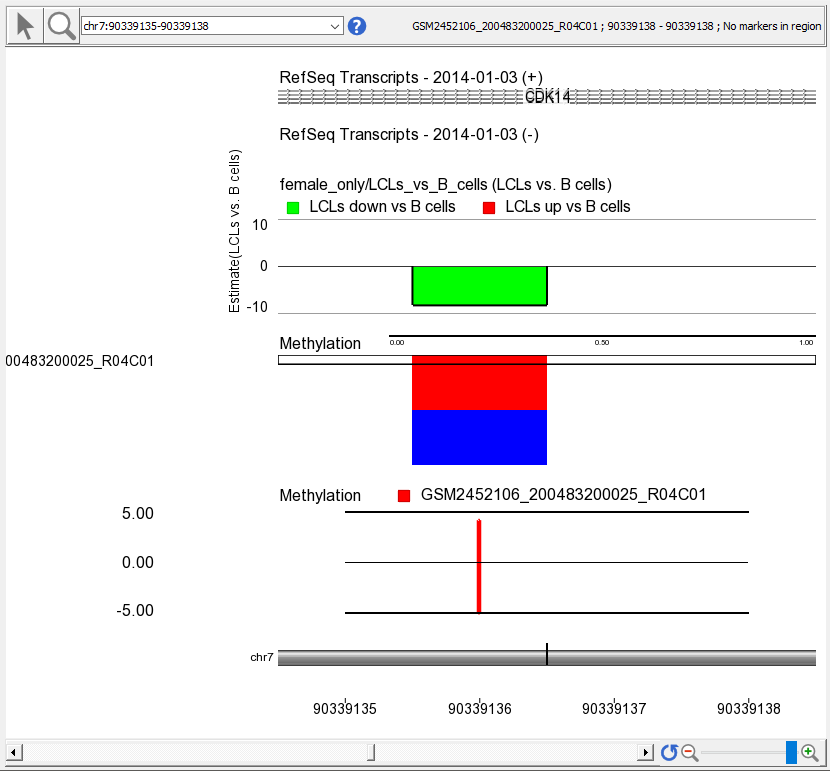
- Select a sample to display in the Bar Chart track by left-clicking on a row in the heat map
A bar indicating the M value at this probe set will appear in the Bar Chart track (Figure 3). color regions by up or down methylated.
- Select the Heatmap (1/mvalue)
- Select Remove Track
- Select Bar Chart (Methylation) located directly below the Regions track
- Select Remove Track
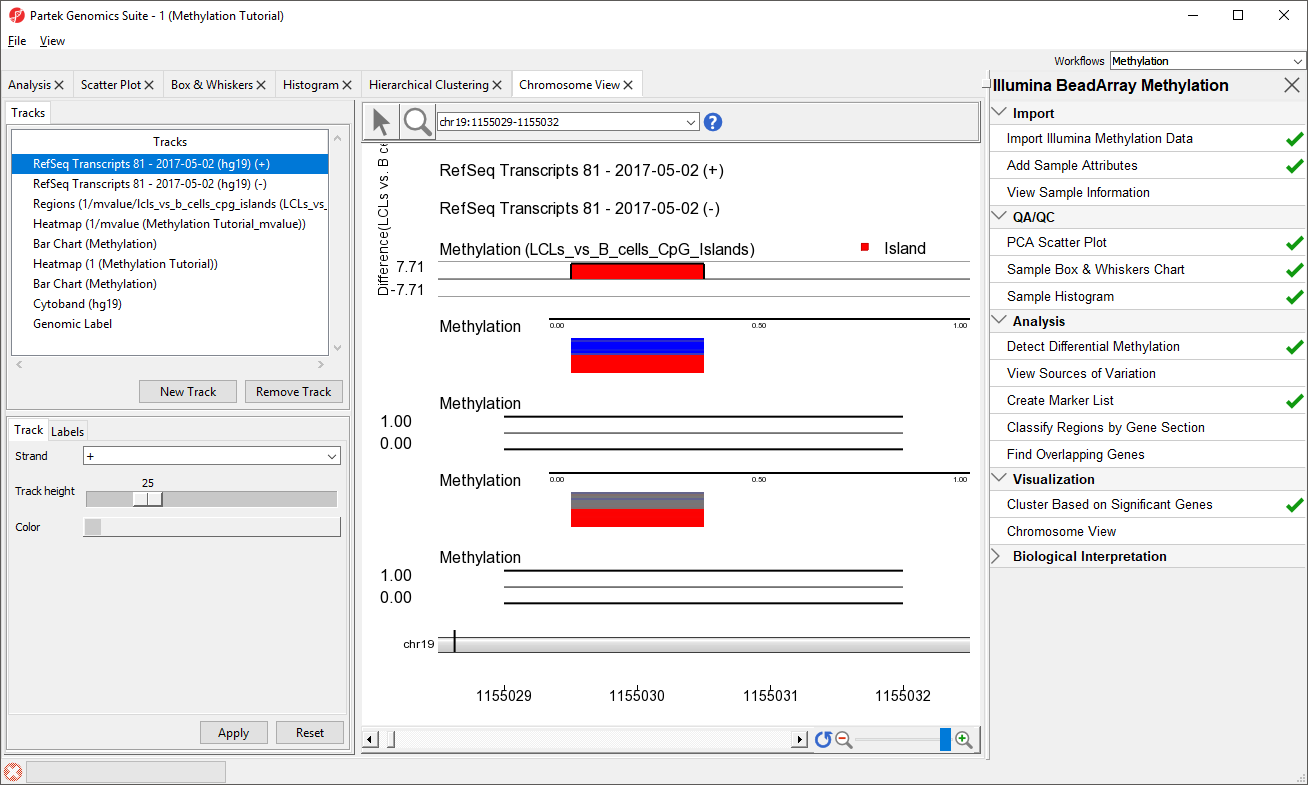
We can now more clearly see the Difference in M values for the region in the Regions track, the heatmap of beta values in the Heatmap track, and the beta value for the loci of the selected sample in the Bar Chart track.
- Select a sample on the heatmap to view its beta value in the Bar Chart track (Figure 3)
| Numbered figure captions | ||||
|---|---|---|---|---|
| ||||
|
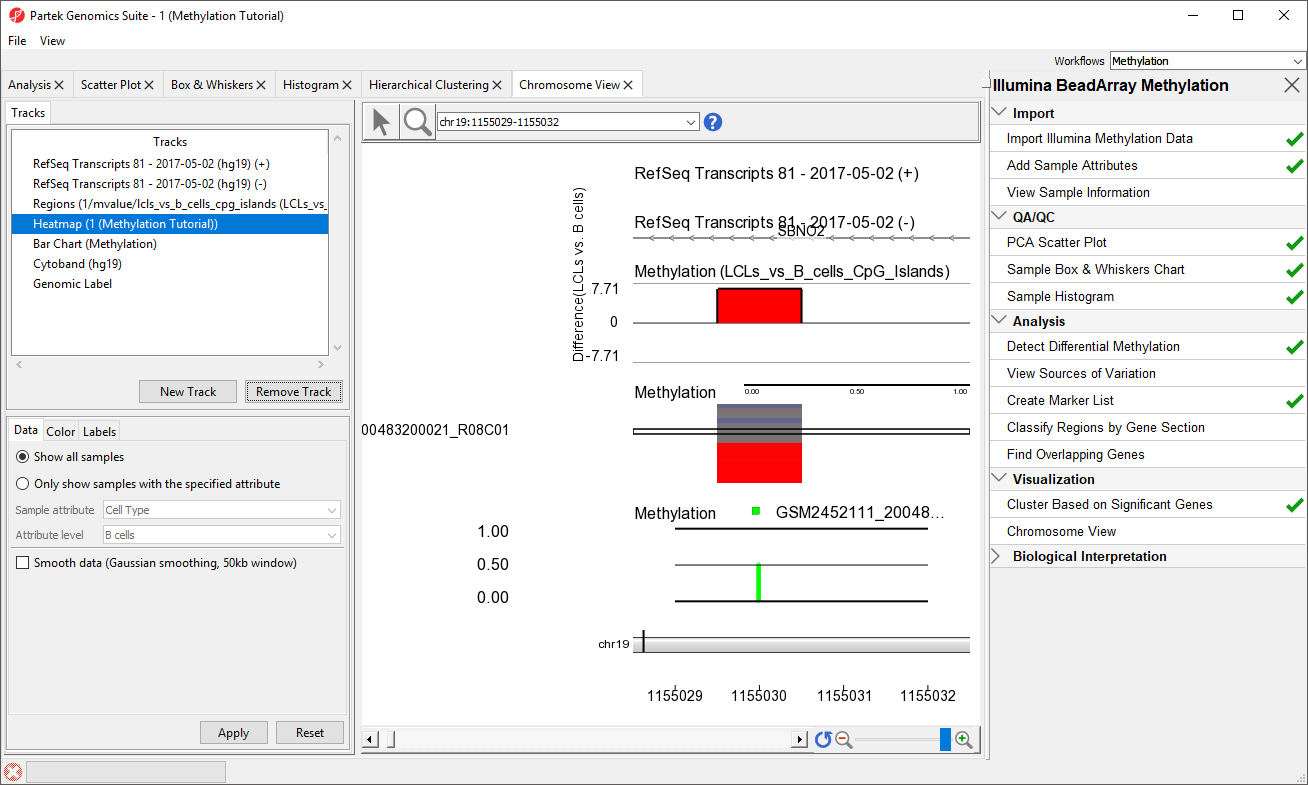
The New Track button allows new tracks to be added to the viewer, while the Remove Track button removes the selected track from the viewer. Tracks can be reordered by selecting a track in the Tracks panel and dragging it up or down to move it in the list. In the Chromosome View, select (![]() ) for selection mode and (
) for selection mode and (![]() ) for navigation mode. In navigation mode, left-click and draw a box on any track to zoom in. All tracks are synced and will zoom together. Zooming can also be controlled using the interface in the lower right-hand corner of the tab (
) for navigation mode. In navigation mode, left-click and draw a box on any track to zoom in. All tracks are synced and will zoom together. Zooming can also be controlled using the interface in the lower right-hand corner of the tab ( ). View can be reset to the whole chromosome level using reset zoom (
![]() ). Searching for a gene or transcript in the position box will also zoom directly to its location.
). Searching for a gene or transcript in the position box will also zoom directly to its location.
...
Overview
Content Tools