Page History
...
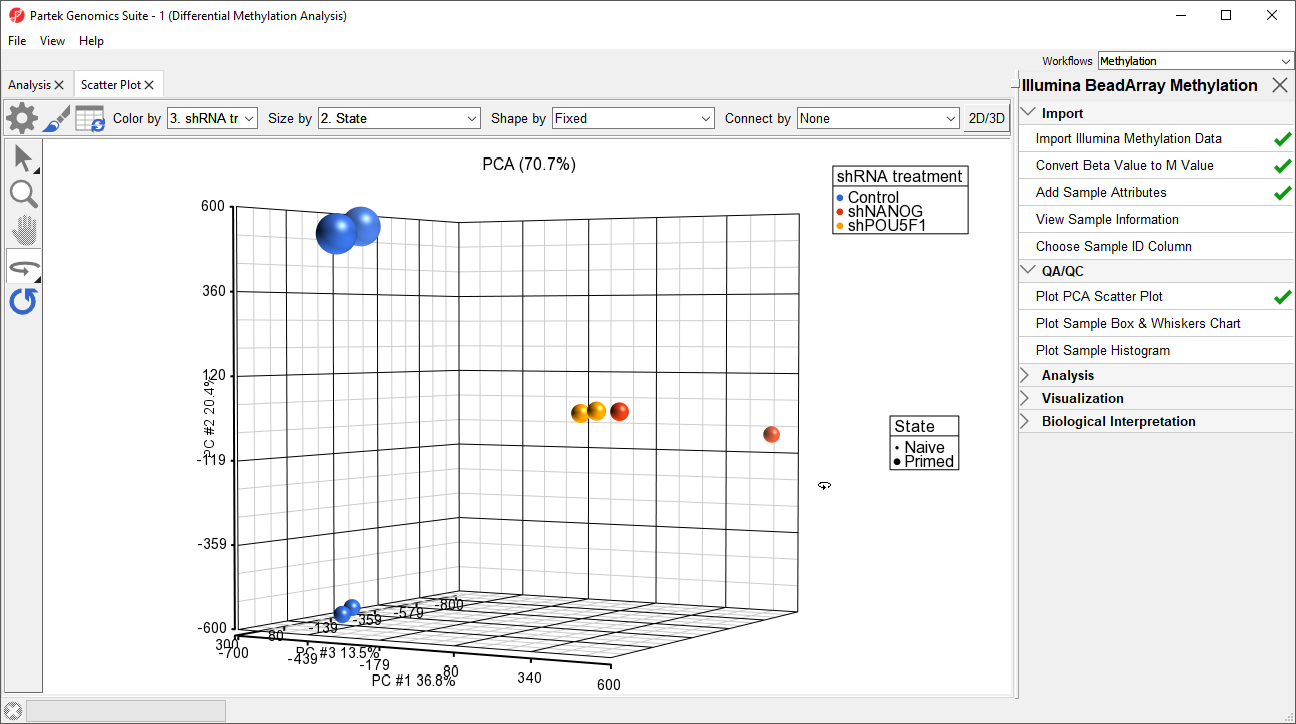
- Select Plot PCA Scatter Plot from the QA/QC section of the Illumina BeadArray Methylation workflow to bring up a Scatter Plot tab
- Select 32. shRNA Experimental Group for Color by and 2. State for Size by
- Select (
 ) to enable Rotate Mode
 - Left click and drag to rotate the plot and view different angles (Figure 1)
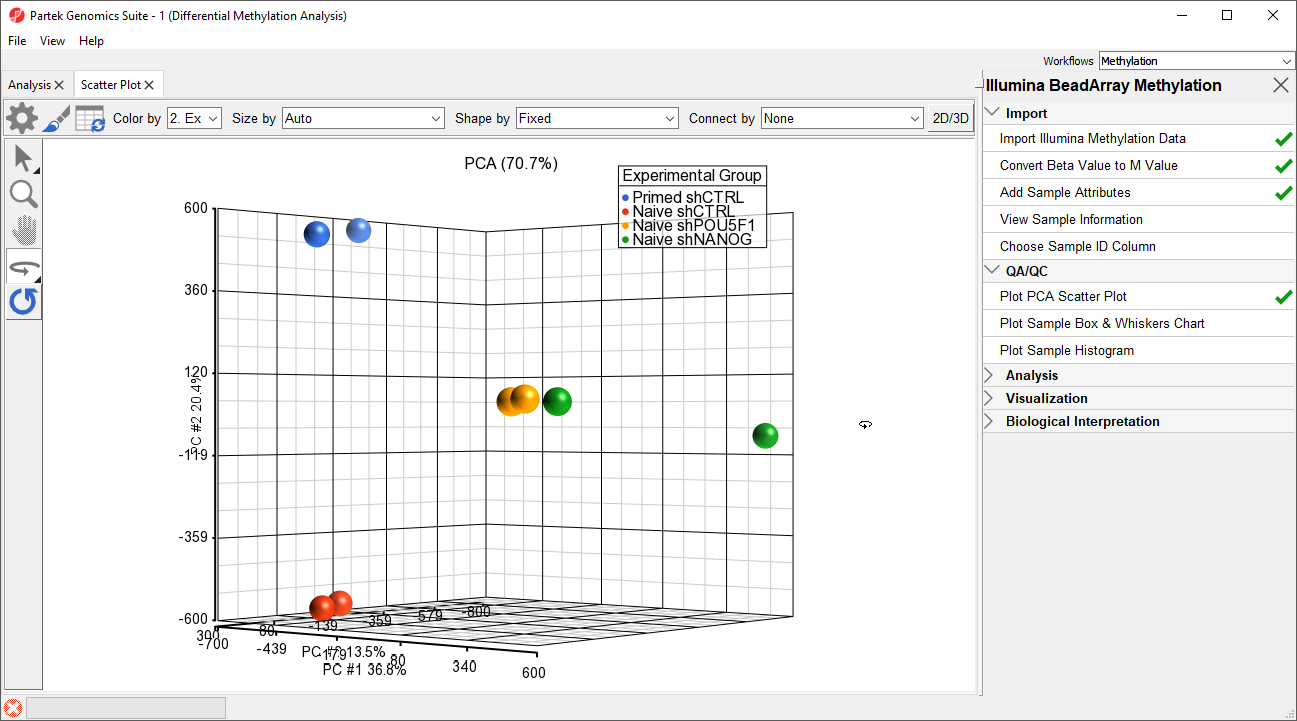
Each dot of the plot is a single sample and represents the average methylation status across all CpG loci. We can see clear separation of naive and primed hPSCs from the naive hPSCs transduced with shRNA lentiviruses (shNANOG and shPOU5F1). One shNANOG sample might be an outlierThe two Naive shNANOG samples do not cluster together, but we will not exclude it them for this tutorial.
| Numbered figure captions | ||||
|---|---|---|---|---|
| ||||
|
Next, distribution of M-values across the samples can also be inspected by a box-and-whiskers plot.
...
Overview
Content Tools