Join us for a webinar: The complexities of spatial multiomics unraveled
May 2
Page History
...
| Numbered figure captions | ||||
|---|---|---|---|---|
| ||||
|
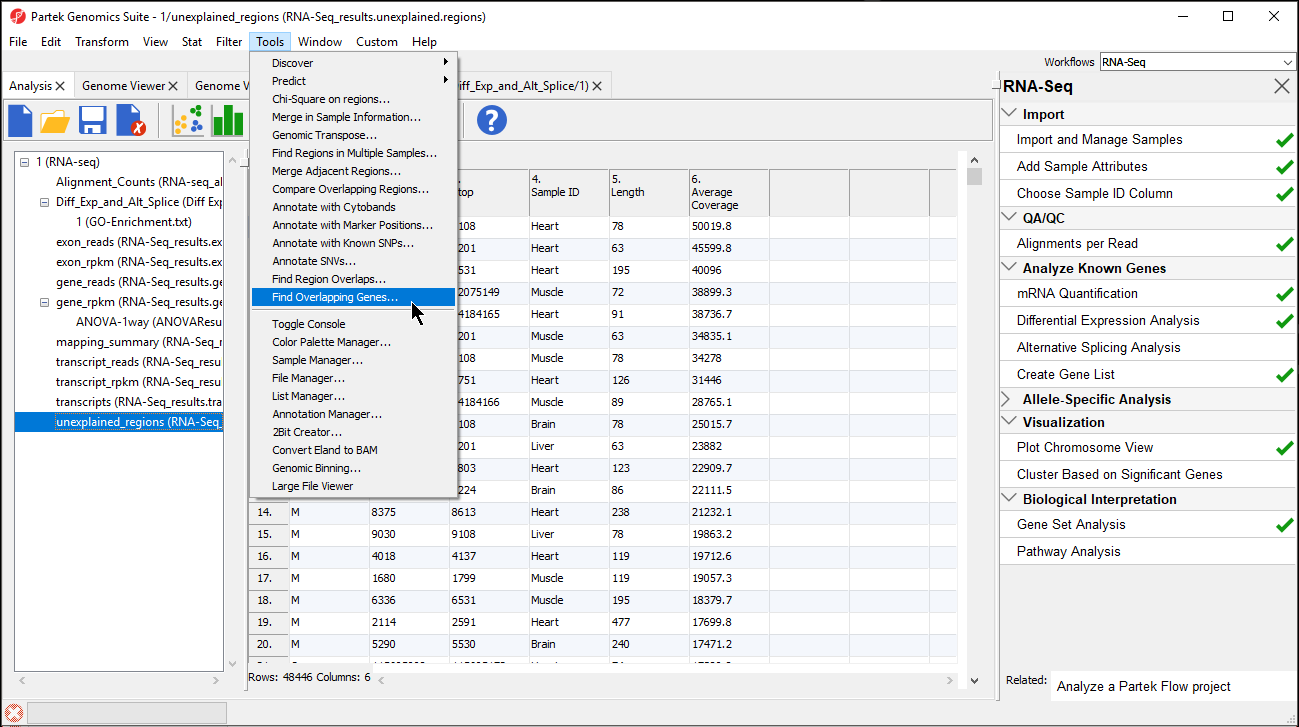
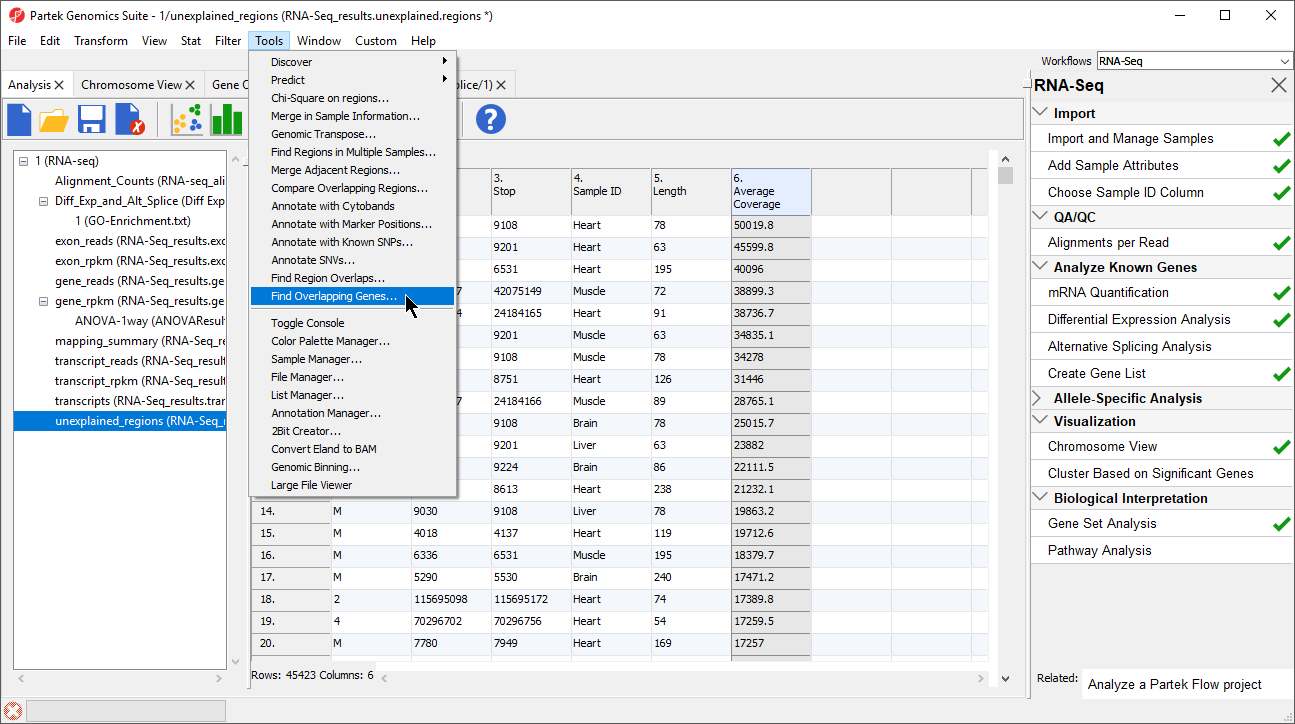
- Select Add a new column with the gene nearest to the region in the Find Overlapping Genes dialog (Figure 2)
- Select OK
...
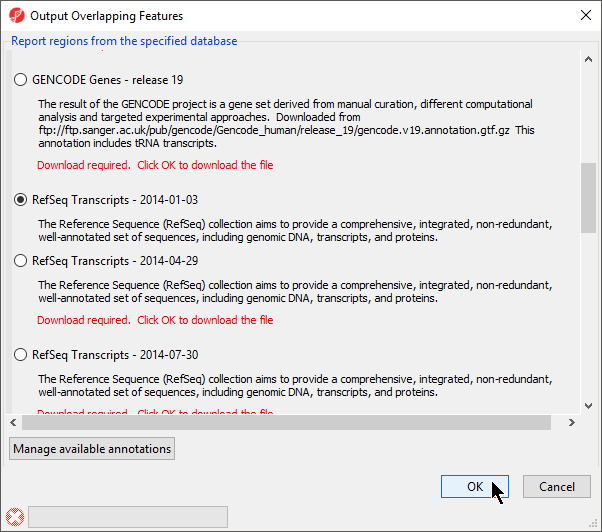
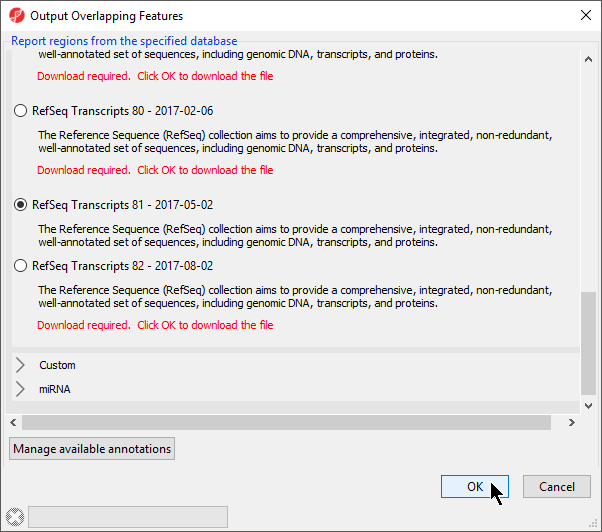
- Select RefSeqTranscripts – 20142017-0105-03 02 from the Output Overlapping Features dialog (Figure 3)
...
| Numbered figure captions | ||||
|---|---|---|---|---|
| ||||
|
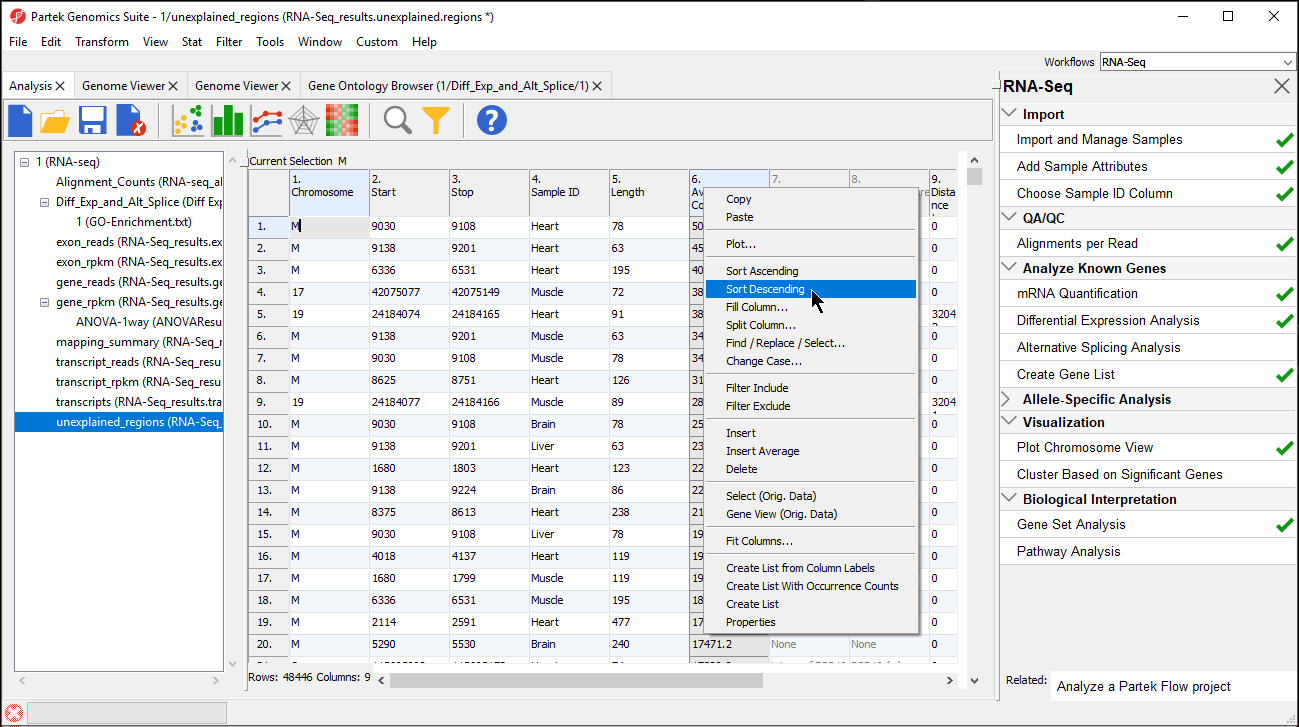
The closest overlapping feature and the distance to it is now included as columns 7. Overlapping Features and 8. Nearest Features in the unexplained_regions spreadsheet.
Right-clicking on a row header and selecting Browse to Location will show the reads mapped to the chromosome. For this tutorial, a couple of genes are selected to show regions that are located after a known gene or in the intron of a gene.
...
| Numbered figure captions | ||||
|---|---|---|---|---|
| ||||
|
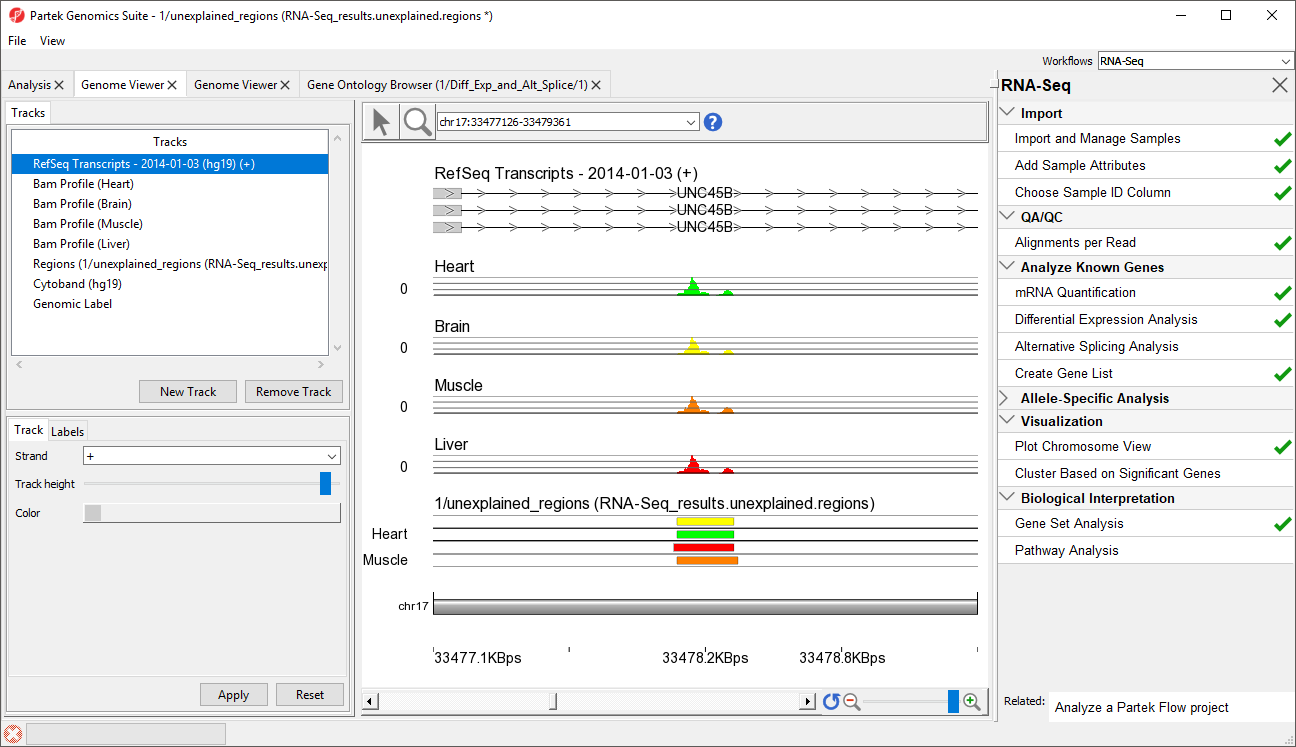
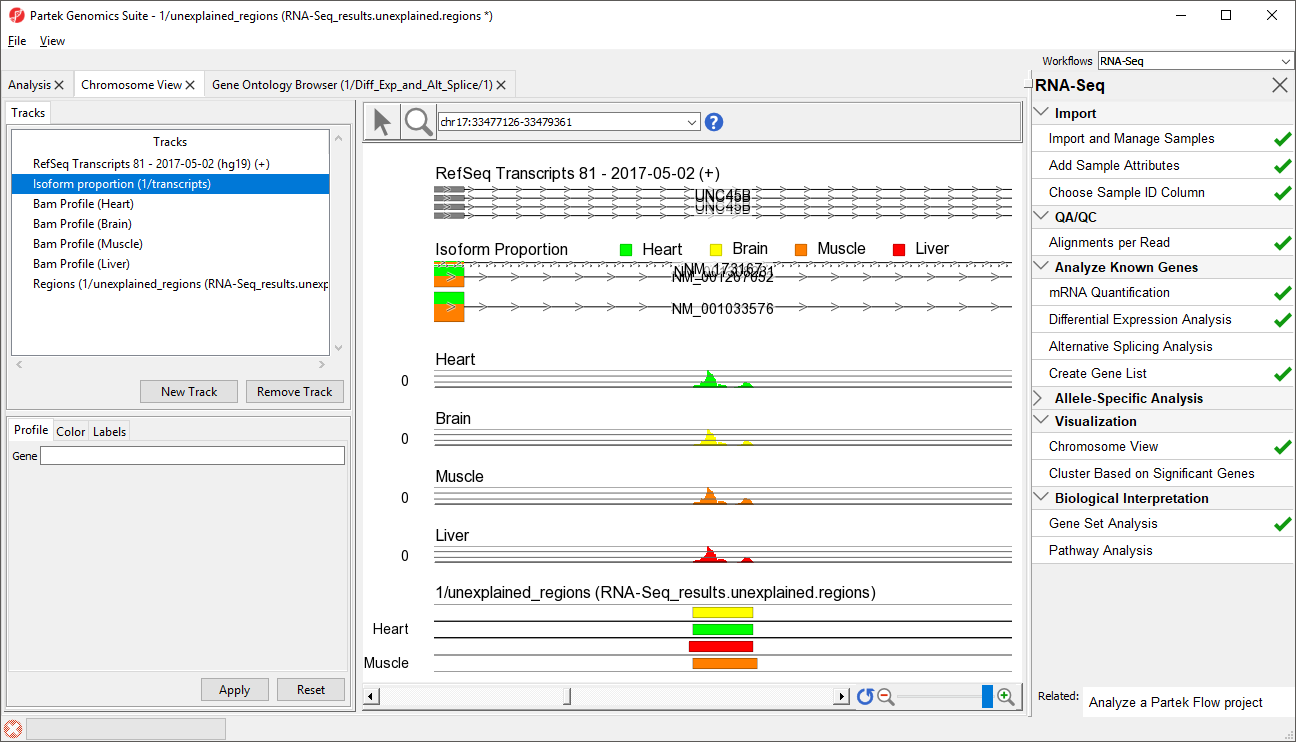
- Select row 45 and Browse to location to show Right-click row 39 and select Browse to location from the pop-up menu
- Select the Chromosome View tab to view a region within an intron of UNC45B. This may be a novel exon (Figure 54)
| Numbered figure captions | ||||
|---|---|---|---|---|
| ||||
|
...
|
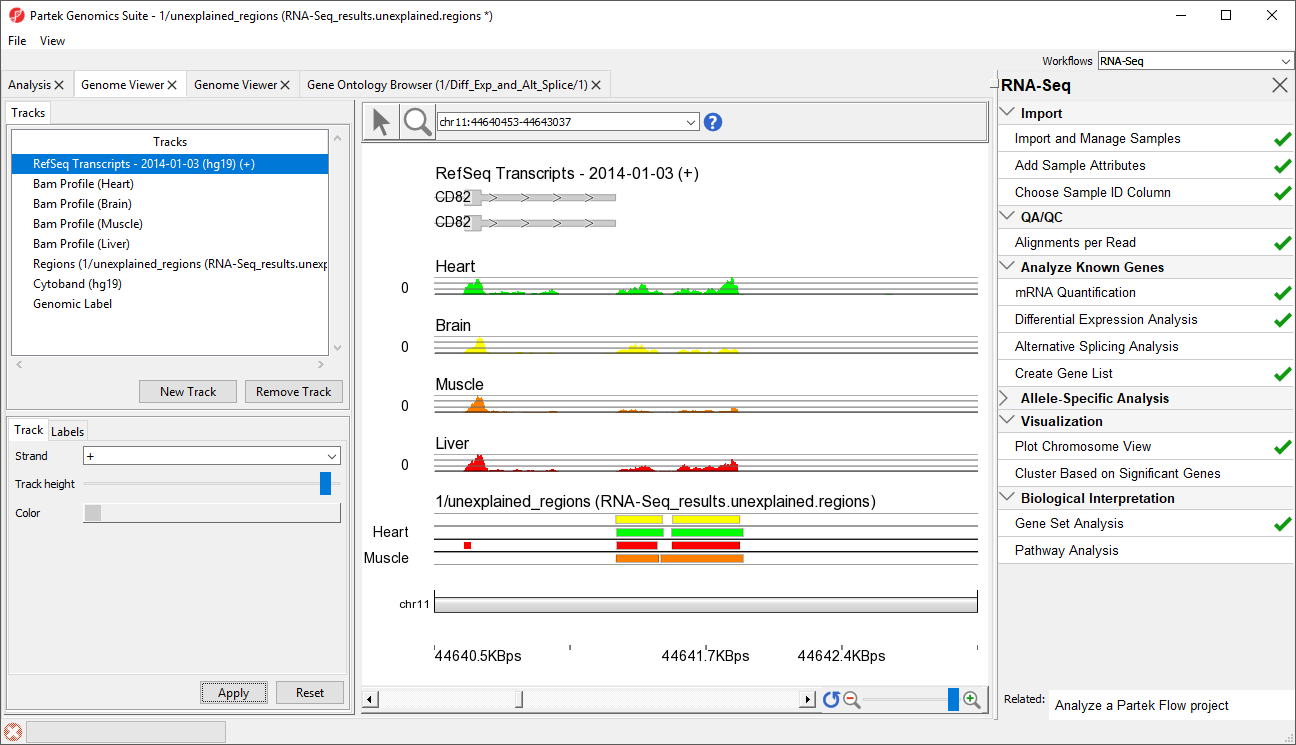
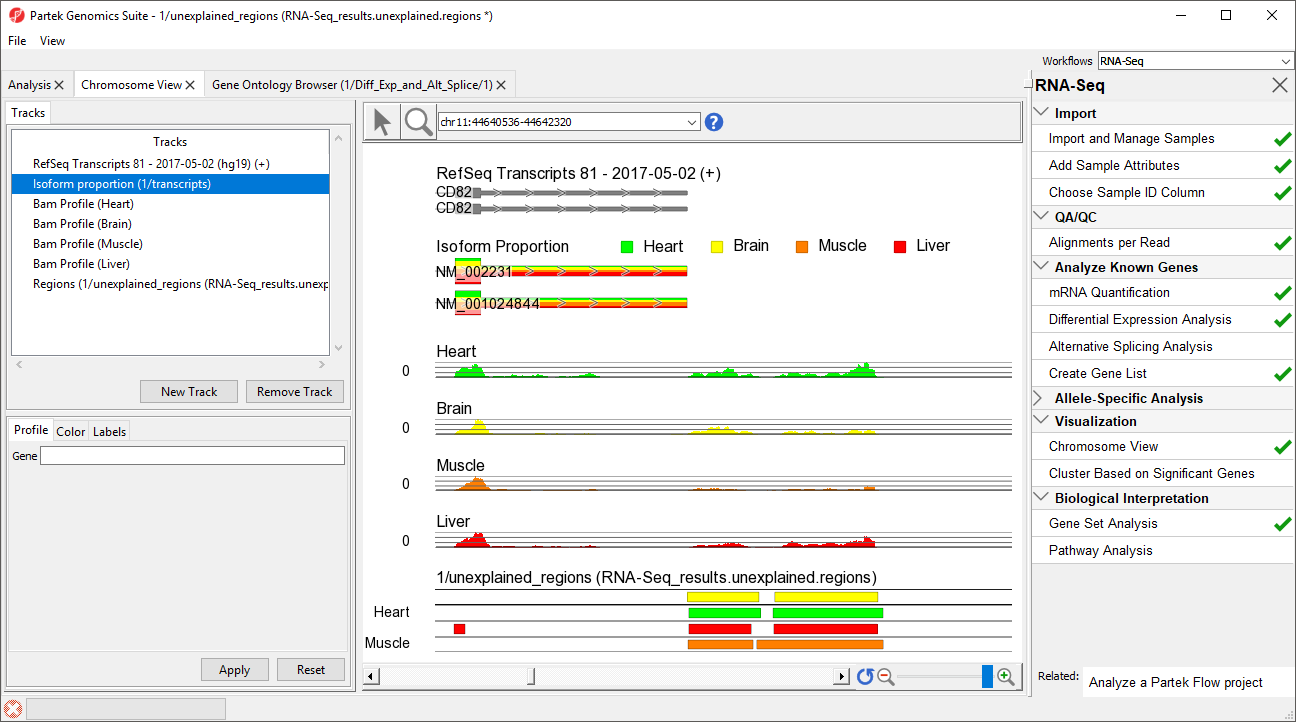
- Right-click row 12576 and select Browse to location to show go to a region that starts 1 bp after CD82.
- Select (
 ) several times to zoom out slightly
This peak may represent an extended exon (Figure
...
5).
| Numbered figure captions | ||||
|---|---|---|---|---|
| ||||
|
While RefSeq was used to identify overlapping features, the choice of which database to use will depend on the biological context of your experiment. For example, you may wish to utilize promoter or miRNA databases if you are interested in regulation of expression.
...
Overview
Content Tools